Patterns of Biodiversity Distribution on Earth
Variation of Species Diversity with Latitude
Understanding the Latitudinal Diversity Gradient
Biodiversity, the variety of life forms across all biological levels, exhibits a distinct pattern when observed globally. One of the most prominent trends is the change in species richness as one moves from the equator towards the poles. This phenomenon, known as the latitudinal diversity gradient, shows that tropical regions near the equator harbor the greatest number of plant and animal species, while diversity diminishes progressively towards polar areas.
This pattern is generally consistent, with only a few exceptions among certain species. For instance, tropical countries like India demonstrate high species richness, and the Amazon rainforest is renowned for its unparalleled biodiversity, with many species still undiscovered. Several ecological factors contribute to this trend:
The tropics experience a relatively stable climate year-round, reducing the need for species to adapt to seasonal changes, thus supporting more species.
Temperate zones have undergone significant glaciation events, leading to environmental instability and fewer opportunities for species diversification compared to the tropics.
Higher solar energy availability in tropical regions enhances photosynthesis, providing more energy to support diverse food webs and greater species variety.
Example Problem
In a hypothetical tropical forest, the average annual temperature remains constant at 27°C, while a temperate forest experiences temperatures ranging from -5°C in winter to 25°C in summer. Explain how these temperature differences influence species diversity in these two regions.
Solution:
The tropical forest's stable temperature allows species to thrive without needing to adapt to drastic seasonal changes, promoting higher species richness.
The temperate forest's fluctuating temperatures require species to adapt to cold winters, limiting the number of species that can survive.
Therefore, the tropical forest supports a more diverse ecosystem due to its climatic stability.
Influence of Area on Species Richness
Exploring the Species-Area Relationship
Another fundamental pattern in biodiversity studies is the relationship between the size of a habitat and the number of species it supports. This concept, first noted by Alexander von Humboldt, states that as the area surveyed increases, the number of species observed also rises, but only up to a certain limit. This relationship is mathematically expressed as:
\[ \log S = \log C + Z \log A \]
where:
\(S\) represents species richness,
\(C\) is the intercept constant,
\(Z\) is the slope or regression coefficient,
\(A\) denotes the area surveyed.
This formula indicates a logarithmic increase in species number with increasing area, reflecting that larger habitats tend to support more species due to greater habitat diversity and resources.
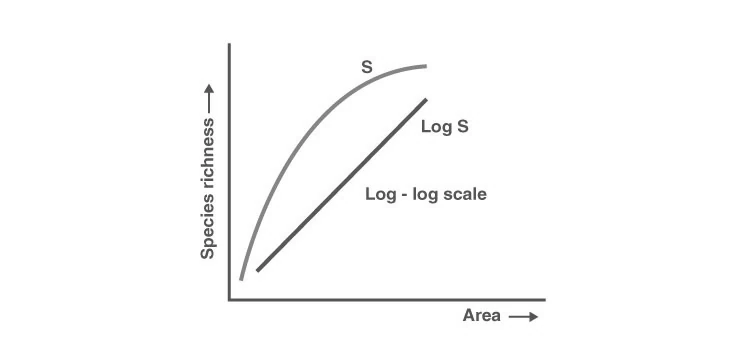
Graphical representation of the species-area relationship
Example Problem
A conservationist studies two forest patches: one of 50 \(\text{km}^2\) and another of 200 \(\text{km}^2\). If the species richness in the smaller patch is 120 and the regression coefficient \(Z\) is 0.25, estimate the expected species richness in the larger patch. Assume \(\log C\) remains constant.
Solution:
Using the species-area formula:
\[ \log S = \log C + Z \log A \]
Let \(S_1 = 120\) at \(A_1 = 50\), and \(S_2\) at \(A_2 = 200\).
Calculate \(\log C\):
\[ \log 120 = \log C + 0.25 \log 50 \]
Calculate \(\log 120 \approx 2.079\), \(\log 50 \approx 1.699\), so:
\[ 2.079 = \log C + 0.25 \times 1.699 = \log C + 0.425 \]
Therefore, \(\log C = 2.079 - 0.425 = 1.654\).
Now, find \(\log S_2\):
\[ \log S_2 = 1.654 + 0.25 \log 200 \]
\(\log 200 \approx 2.301\), so:
\[ \log S_2 = 1.654 + 0.25 \times 2.301 = 1.654 + 0.575 = 2.229 \]
Convert back to species richness:
\[ S_2 = 10^{2.229} \approx 169.8 \]
Thus, the larger forest patch is expected to have approximately 170 species.
Global Patterns in Biodiversity Distribution
Overview of Biodiversity Trends Worldwide
Biodiversity encompasses the variety of living organisms across all levels of biological organization. Ecologists have identified two primary patterns that describe how species diversity is distributed globally: the latitudinal gradient and the species-area relationship. These patterns help explain why certain regions, such as tropical rainforests, are hotspots of biodiversity, while others, like polar areas, have fewer species.
Understanding these patterns is crucial for conservation efforts and ecological research, as they highlight the importance of preserving large, stable habitats in tropical zones to maintain global biodiversity.
Example Question
Why do tropical regions generally support more species than temperate or polar regions? Provide three ecological reasons.
Answer:
Tropical climates are more stable year-round, reducing environmental stress on species.
Higher solar energy input increases primary productivity, supporting more complex food webs.
Less recent glaciation in tropics has allowed longer periods for species diversification.
Quick Reference: Key Biodiversity Concepts
Concept | Description |
|---|---|
Latitudinal Diversity Gradient | Species richness decreases from the equator towards the poles. |
Species-Area Relationship | Species number increases with habitat area, following \(\log S = \log C + Z \log A\). |
Species Richness (\(S\)) | The total number of different species in a given area. |
Regression Coefficient (\(Z\)) | Slope indicating how species richness changes with area size. |
Intercept Constant (\(C\)) | Y-intercept in the species-area logarithmic equation. |
Speciation | The evolutionary process by which new species arise. |
Glaciation | Periods of extensive ice coverage affecting species distribution. |
Primary Productivity | Rate at which plants produce organic material via photosynthesis. |
Habitat Stability | Consistency of environmental conditions over time. |
Ecological Hotspot | Region with exceptionally high biodiversity and endemism. |
Glossary of Important Terms
Term | Definition |
|---|---|
Biodiversity | The variety of life forms at genetic, species, and ecosystem levels. |
Latitudinal Gradient | Variation in species diversity from equator to poles. |
Species Richness | Number of different species present in a specific area. |
Species-Area Curve | Graph showing the relationship between area size and species number. |
Regression Coefficient (\(Z\)) | Parameter indicating the rate of increase in species with area. |
Speciation | Formation of new and distinct species in the course of evolution. |
Glaciation | Period of global cooling resulting in ice sheet expansion. |
Primary Productivity | Production of organic compounds from carbon dioxide through photosynthesis. |
Habitat Stability | Degree to which environmental conditions remain constant over time. |
Ecological Hotspot | Area with significant levels of biodiversity under threat. |
Frequently Asked Questions
What is meant by the species-area relationship?
It describes how the number of species increases with the size of the area surveyed, following a logarithmic pattern up to a limit.
How does species richness vary with latitude?
Species richness is highest near the equator and decreases progressively towards the poles.
What does a higher value of the regression coefficient \(Z\) indicate?
A steeper \(Z\) value suggests that species richness increases more rapidly with area, often seen in larger regions like continents.
Why do tropical regions have more biodiversity than temperate zones?
Because of stable climates, higher solar energy, and less impact from glaciation, tropical regions support more species.
How does habitat stability affect species diversity?
Stable habitats allow species to thrive and diversify without frequent environmental stress or adaptation pressures.