Understanding Mean Deviation: Concepts, Formulas, and Applications
Fundamentals of Mean Deviation
Conceptual Overview of Mean Deviation
Mean deviation is a statistical tool that quantifies the average distance of data points from a central value, typically the mean. It provides insight into the spread or dispersion within a dataset by measuring how far individual observations deviate from the average. This measure helps in understanding the variability inherent in the data.
To compute mean deviation, one first determines the mean of the dataset, then calculates the absolute differences between each data point and this mean, and finally averages these absolute differences. This approach ensures that deviations below and above the mean do not cancel each other out.
Example Problem
Calculate the mean deviation for the dataset: 6, 2, 9, 5, 7, 3.
Solution:
Step 1: Compute the mean:
\[ \mu = \frac{6 + 2 + 9 + 5 + 7 + 3}{6} = \frac{32}{6} \approx 5.33 \]
Step 2: Find absolute deviations:
\[ |6 - 5.33| = 0.67, \quad |2 - 5.33| = 3.33, \quad |9 - 5.33| = 3.67, \]
\[ |5 - 5.33| = 0.33, \quad |7 - 5.33| = 1.67, \quad |3 - 5.33| = 2.33 \]
Step 3: Calculate mean deviation:
\[ \text{Mean Deviation} = \frac{0.67 + 3.33 + 3.67 + 0.33 + 1.67 + 2.33}{6} = \frac{11.99}{6} \approx 2.00 \]
Thus, the mean deviation is approximately 2.00.
Calculating Mean Deviation for Grouped Data
Mean Deviation in Discrete Frequency Distributions
When data is organized into groups with associated frequencies, calculating mean deviation requires considering these frequencies. Discrete frequency distribution involves distinct data values each occurring a certain number of times. The mean deviation is then computed relative to a central measure such as the mean or median of the grouped data.
The process involves:
- Determining the central tendency (mean or median) of the grouped data.
- Calculating the absolute difference between each group value and the central measure.
- Multiplying these absolute differences by their respective frequencies.
- Dividing the sum of these products by the total number of observations.
This method provides a weighted average of deviations, reflecting the distribution's spread more accurately.
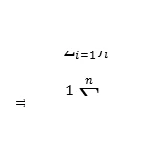
For a dataset with values \( x_i \) and frequencies \( f_i \), the mean deviation about the mean \( \mu \) is:
\[ \text{Mean Deviation} = \frac{\sum_{i=1}^n f_i |x_i - \mu|}{\sum_{i=1}^n f_i} \]
Example Problem
Given the following data of test scores and their frequencies, find the mean deviation about the mean:
| Score (x) | Frequency (f) |
|---|---|
| 10 | 3 |
| 15 | 5 |
| 20 | 2 |
| 25 | 4 |
Solution:
Step 1: Calculate total frequency:
\[ N = 3 + 5 + 2 + 4 = 14 \]
Step 2: Compute mean:
\[ \mu = \frac{(10 \times 3) + (15 \times 5) + (20 \times 2) + (25 \times 4)}{14} = \frac{30 + 75 + 40 + 100}{14} = \frac{245}{14} \approx 17.5 \]
Step 3: Calculate absolute deviations and multiply by frequencies:
\[ |10 - 17.5| \times 3 = 7.5 \times 3 = 22.5 \]
\[ |15 - 17.5| \times 5 = 2.5 \times 5 = 12.5 \]
\[ |20 - 17.5| \times 2 = 2.5 \times 2 = 5 \]
\[ |25 - 17.5| \times 4 = 7.5 \times 4 = 30 \]
Step 4: Sum of weighted deviations:
\[ 22.5 + 12.5 + 5 + 30 = 70 \]
Step 5: Calculate mean deviation:
\[ \text{Mean Deviation} = \frac{70}{14} = 5 \]
Therefore, the mean deviation about the mean is 5.
Mean Deviation Computation Using Median
Determining Mean Deviation Around the Median
Instead of the mean, the median can serve as the central reference point for calculating mean deviation. The median is the middle value when data is arranged in ascending order, providing a measure less affected by extreme values. The mean deviation about the median is found by averaging the absolute differences between each data point and the median.
For grouped data, the median is identified by locating the class interval where the cumulative frequency reaches or exceeds half the total observations. This approach is particularly useful when data contains outliers or is skewed.
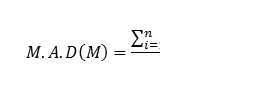
Once the median \( M \) is found, mean deviation is calculated as:
\[ \text{Mean Deviation} = \frac{\sum_{i=1}^n f_i |x_i - M|}{\sum_{i=1}^n f_i} \]
Example Problem
Consider the following data representing weekly hours spent on hobbies and their frequencies. Find the mean deviation about the median.
| Hours (x) | Frequency (f) |
|---|---|
| 2 | 4 |
| 4 | 6 |
| 6 | 5 |
| 8 | 3 |
Solution:
Step 1: Total frequency:
\[ N = 4 + 6 + 5 + 3 = 18 \]
Step 2: Find cumulative frequencies:
\[ 4, \quad 4 + 6 = 10, \quad 10 + 5 = 15, \quad 15 + 3 = 18 \]
Step 3: Locate median class (where cumulative frequency ≥ \( \frac{N}{2} = 9 \)) is the second class (4 hours).
Step 4: Median value is 4 hours.
Step 5: Calculate absolute deviations multiplied by frequencies:
\[ |2 - 4| \times 4 = 2 \times 4 = 8 \]
\[ |4 - 4| \times 6 = 0 \times 6 = 0 \]
\[ |6 - 4| \times 5 = 2 \times 5 = 10 \]
\[ |8 - 4| \times 3 = 4 \times 3 = 12 \]
Step 6: Sum of weighted deviations:
\[ 8 + 0 + 10 + 12 = 30 \]
Step 7: Mean deviation about median:
\[ \frac{30}{18} \approx 1.67 \]
Hence, the mean deviation about the median is approximately 1.67 hours.
Summary Table for Quick Reference
| Concept | Formula | Notes |
|---|---|---|
| Mean Deviation (Individual Data) | \(\displaystyle \frac{\sum |x_i - \mu|}{N}\) | Average absolute deviation from mean |
| Mean Deviation (Grouped Data) | \(\displaystyle \frac{\sum f_i |x_i - \mu|}{\sum f_i}\) | Weighted average deviation using frequencies |
| Mean Deviation about Median | \(\displaystyle \frac{\sum f_i |x_i - M|}{\sum f_i}\) | Uses median as central measure |
| Mean (\(\mu\)) | \(\displaystyle \frac{\sum f_i x_i}{\sum f_i}\) | Weighted average of data values |
| Median (Grouped Data) | Value where cumulative frequency \(\geq \frac{N}{2}\) | Middle value in ordered data |
Key Terms and Definitions
| Term | Definition |
|---|---|
| Mean | The average of all data points calculated by summing values and dividing by count. |
| Median | The middle value in an ordered dataset dividing it into two equal halves. |
| Mean Deviation | The average of absolute differences between data points and a central value. |
| Frequency | The number of times a particular data value occurs. |
| Discrete Distribution | A frequency distribution with distinct, separate values. |
| Absolute Deviation | The non-negative difference between a data point and a central measure. |
| Central Tendency | A measure that represents the center of a data distribution (mean, median, mode). |
| Cumulative Frequency | The running total of frequencies up to a certain class or value. |
| Dispersion | The extent to which data values spread around a central value. |
| Grouped Data | Data organized into classes or intervals with associated frequencies. |
Frequently Asked Questions
What information does mean deviation provide about a dataset?
Mean deviation indicates the average distance of data points from the central value, reflecting the data's variability.
How is mean deviation calculated for individual data points?
Calculate the mean, find absolute differences between each data point and the mean, then average these differences.
Why might one use median instead of mean for mean deviation?
Median is less affected by extreme values, making mean deviation about median more robust for skewed data.
What are the advantages of using mean deviation over other dispersion measures?
Mean deviation is simple to compute, easy to interpret, and considers all data points, providing a clear measure of spread.
In what forms of data can mean deviation be applied?
Mean deviation can be applied to individual data, discrete frequency distributions, and continuous frequency distributions.