CLASS 9 . MATHEMATICS . GANITA MANJARI . THE MATHEMATICS-OF-MAYBE-INTRODUCTION-TO-PROBABILITY
Chapter 7 : The Mathematics of Maybe: Introduction to Probability
Ch 7
MATHEMATICS
CLASS 9
Introduction to Probability
Probability is a mathematical measurement of the likelihood of an event occurring. Unlike physical quantities such as length or volume, probability quantifies uncertainty and chance. It helps express how confident we are that a particular event will happen, such as predicting rain or the outcome of a game.
Probability values range from 0 to 1, where 0 means the event is impossible, and 1 means the event is certain. Values between 0 and 1 indicate varying degrees of likelihood.
For example, the probability of your school winning a hockey match might be 0.75, meaning a 75% chance of winning, which is more likely than not.
Worked Illustration: Consider a deck of six cards with varying numbers of purple and green cards. The probability of drawing a purple card changes from impossible (0) to certain (1) as the number of purple cards increases.
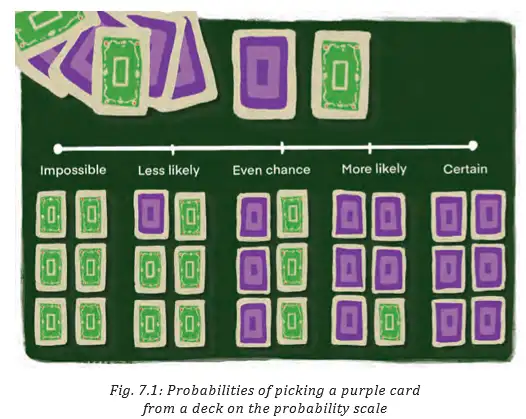
This visualizes the probability scale from impossible to certain.
Practice Set
- Level 1: Identify the probability of getting heads in a single coin toss.
- Level 2: Estimate the probability of drawing a red card from a deck of 52 cards.
- Level 3: Given a bag with 3 red, 5 blue, and 2 green balls, find the probability of drawing a blue ball.
Answer Key
- Level 1: 0.5 or 50%
- Level 2: 26/52 = 0.5 or 50%
- Level 3: 5/10 = 0.5 or 50%
Quick Reference
- Probability scale: 0 (impossible) to 1 (certain)
- Probability expresses likelihood of events
Glossary
- Event: A possible outcome or set of outcomes.
- Probability: Measure of likelihood of an event.
Randomness and Random Experiments
Randomness refers to situations where the exact outcome cannot be predicted, even though all possible outcomes are known. Examples include tossing a coin or rolling a die.
A random experiment is a repeatable process with uncertain outcomes, such as tossing a coin multiple times.
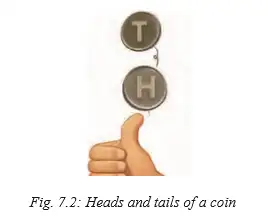
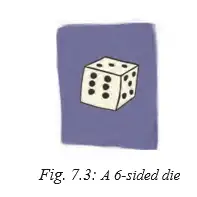
Worked Illustration: Tossing a coin can result in Heads (H) or Tails (T). Rolling a die can result in numbers 1 through 6.
Practice Set
- Level 1: List the sample space for tossing a single coin.
- Level 2: List the sample space for rolling a six-sided die.
- Level 3: Describe the sample space for tossing two coins simultaneously.
Answer Key
- Level 1: {H, T}
- Level 2: {1, 2, 3, 4, 5, 6}
- Level 3: {HH, HT, TH, TT}
Quick Reference
- Random experiment: Repeatable with uncertain outcomes
- Sample space: Set of all possible outcomes
Glossary
- Randomness: Unpredictability of outcomes
- Sample Space: All possible outcomes of an experiment
Probability Scale
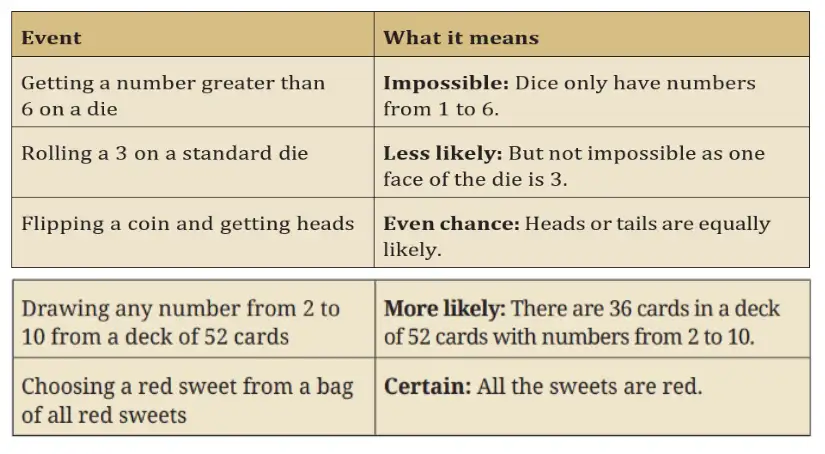
The probability scale measures likelihood from 0 (impossible) to 1 (certain). It helps compare how likely different events are.
Examples of events and their probabilities include impossible events (probability 0), equally likely events (probability 0.5), and certain events (probability 1).
Practice Set
- Level 1: Identify an impossible event when rolling a die.
- Level 2: Determine the probability of getting heads in a coin toss.
- Level 3: Find the probability of drawing a red sweet from a bag containing only red sweets.
Answer Key
- Level 1: Getting a number greater than 6 (probability 0)
- Level 2: 0.5 or 50%
- Level 3: 1 or 100%
Quick Reference
- Probability ranges from 0 to 1
- 0 means impossible, 1 means certain
Glossary
- Probability Scale: Numerical scale from 0 to 1 indicating likelihood
Experimental Probability
Experimental probability is estimated by performing an experiment multiple times and calculating the relative frequency of the event.
Formula:
Experimental Probability = Number of times event occurred / Total number of trials
Example: Rolling a die 50 times and getting a 4 eight times.
Experimental probability of rolling a 4 = 8/50 = 0.16 or 16%.
This method uses actual data rather than theoretical assumptions.
Practice Set
- Level 1: Toss a coin 20 times and record the number of heads. Calculate the experimental probability of heads.
- Level 2: Roll a die 60 times and record the number of times a 5 appears. Calculate the experimental probability of rolling a 5.
- Level 3: Conduct an experiment of drawing a card from a deck 100 times and record the frequency of drawing a heart. Calculate the experimental probability.
Answer Key
- Level 1: Experimental Probability = (Number of heads) / 20
- Level 2: Experimental Probability = (Number of times 5 appears) / 60
- Level 3: Experimental Probability = (Number of hearts drawn) / 100
Quick Reference
- Experimental probability = (Number of favorable outcomes) / (Total trials)
- Based on actual experiment data
Glossary
- Experimental Probability: Probability estimated from data collected by performing experiments
- Relative Frequency: Ratio of favorable outcomes to total trials
Theoretical Probability
Theoretical probability assumes all possible outcomes are equally likely and calculates probability by counting favorable outcomes over total outcomes.
Formula:
P(Event) = Number of favourable outcomes / Number of possible outcomes
Example 1: Probability of rolling a 4 on a fair 6-sided die.
Number of favourable outcomes = 1
Number of possible outcomes = 6
P(4) = 1/6 approximately 0.167
Example 2: Probability of picking the letter B from the word "PROBABILITY".
Number of favourable outcomes = 2 (two Bs)
Number of possible outcomes = 11 (letters in the word)
P(B) = 2/11 approximately 0.182
Practice Set
- Level 1: Find the theoretical probability of getting heads in a coin toss.
- Level 2: Find the theoretical probability of rolling an even number on a die.
- Level 3: Find the theoretical probability of drawing a vowel from the letters of the word "MATHEMATICS".
Answer Key
- Level 1: 1/2 = 0.5
- Level 2: 3/6 = 0.5 (even numbers: 2, 4, 6)
- Level 3: Vowels = A, A, I; Total letters = 11; Probability = 3/11 approximately 0.273
Quick Reference
- Theoretical probability = (Favourable outcomes) / (Possible outcomes)
- Assumes equally likely outcomes
Glossary
- Theoretical Probability: Probability calculated from known possible outcomes assuming fairness
Sample Space and Events
The sample space is the set of all possible outcomes of a random experiment, denoted by S. Each outcome is an element of S, and the number of elements is the sample size, n(S).
An event is any subset of the sample space, representing one or more outcomes.
Examples:
- Sample space for rain tomorrow: S = {Rain, No Rain}, n(S) = 2
- Sample space for a match result: S = {Win, Lose, Draw}, n(S) = 3
- Tossing a coin: S = {H, T}, n(S) = 2
- Rolling a die: S = {1, 2, 3, 4, 5, 6}, n(S) = 6
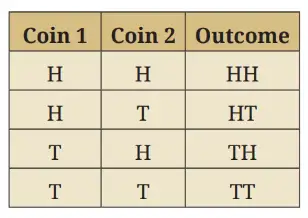
- Tossing two coins: S = {HH, HT, TH, TT}, n(S) = 4
Practice Set
- Level 1: Write the sample space for tossing a single coin.
- Level 2: Write the sample space for rolling a die.
- Level 3: Write the sample space for tossing two coins.
Answer Key
- Level 1: {H, T}
- Level 2: {1, 2, 3, 4, 5, 6}
- Level 3: {HH, HT, TH, TT}
Quick Reference
- Sample space: All possible outcomes
- Event: Subset of sample space
Glossary
- Sample Space: Set of all possible outcomes
- Event: One or more outcomes from the sample space
Tree Diagrams
Tree diagrams visually represent all possible outcomes of multi-step experiments, where each branch shows a possible outcome at each step.
They help list all outcomes and calculate probabilities for complex experiments.
Example: Tossing a fair coin twice.
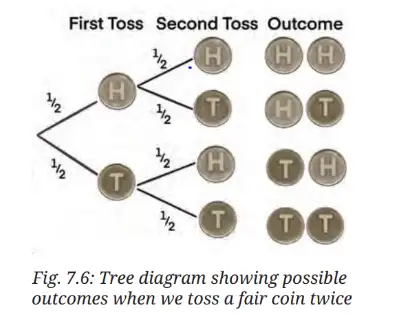
Sample space: S = {HH, HT, TH, TT}
Probability of getting two heads (HH) = 1/4 = 0.25
Practice Set
- Level 1: Draw a tree diagram for tossing a coin twice.
- Level 2: Use a tree diagram to find the probability of getting one head and one tail in two tosses.
- Level 3: Construct a tree diagram for rolling a die twice and find the probability of getting two sixes.
Answer Key
- Level 1: Outcomes are HH, HT, TH, TT
- Level 2: Probability of one head and one tail = 2/4 = 0.5
- Level 3: Probability of two sixes = 1/36
Quick Reference
- Tree diagrams list all possible outcomes of multi-step experiments
- Each branch represents an outcome
Glossary
- Tree Diagram: Visual tool to list outcomes of multi-step experiments