CLASS 12-COMMERCE . ACCOUNTANCY . COMPUTERISED ACCOUNTING SYSTEM . SPREADSHEET
Chapter 2 : Spreadsheet
Ch 2
ACCOUNTANCY
CLASS 12-COMMERCE
Introduction to Spreadsheet
A spreadsheet is a configuration of rows and columns used to record, calculate, and compare numerical or financial data. It is also known as a worksheet. Each value in a spreadsheet can be either a basic value entered by the user or a derived value calculated using arithmetic expressions or functions (formulas).
Spreadsheet applications like MS Excel allow users to enter and process data efficiently. Excel 2007 introduced a redesigned user interface with the "Ribbon" and "Office Button" for easier navigation and file management.
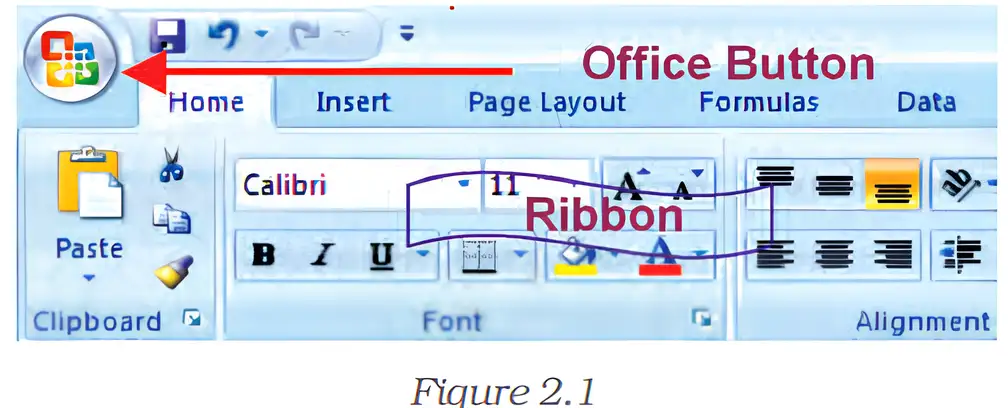
The Office Button provides access to file-related commands such as opening, saving, and printing documents. The Ribbon organizes commands into tabs like Home, Insert, and Page Layout, grouping related functions for quick access.
Key Definitions:
- Workbook: A file in Excel containing multiple worksheets.
- Worksheet: A single sheet within a workbook consisting of rows and columns.
- Active Worksheet: The worksheet currently selected for operations.
- Cell: Intersection of a row and a column, identified by a cell address (e.g., A1).
- Cell Address: Combination of column letter and row number identifying a cell.
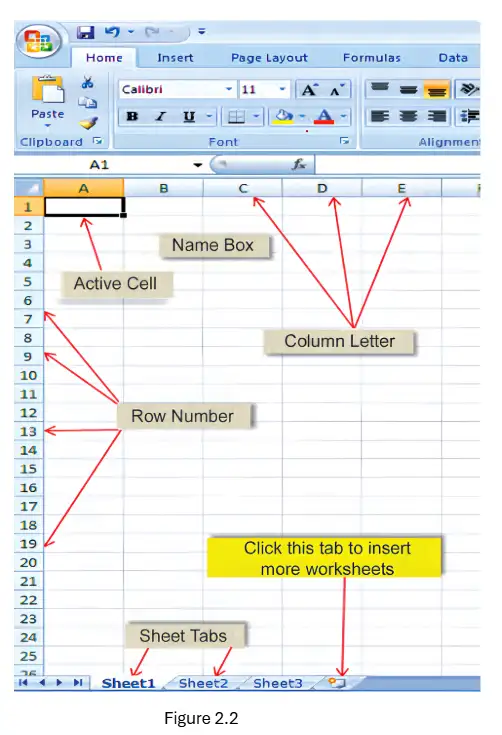
Users can navigate the worksheet using arrow keys or mouse, and cells can contain numeric, alphanumeric, or date data types.
Example: If quantity (Q) of an item is purchased at price (P), the value (V) is derived as V = Q × P, where Q and P are basic values and V is a derived value.
Practice Set:
- Define workbook, worksheet, and cell with examples.
- Explain the difference between basic and derived values with examples.
- Identify parts of the Excel interface shown in the image.
Answer Key:
- A workbook is a file containing multiple worksheets.
- A worksheet is a single sheet with rows and columns.
- A cell is the intersection of a row and column, identified by a cell address like A1.
- Basic values are user-entered data; derived values are calculated using formulas.
Quick Reference: Workbook > Worksheets > Cells > Data Types (Numeric, Text, Date)
Glossary: Workbook, Worksheet, Cell, Cell Address, Formula, Function
Basic Concepts of Spreadsheet
Excel files are called workbooks, which contain multiple worksheets. By default, three worksheets are available, and users can add or rename sheets as needed.
Rows are numbered from 1 to 65,536 and columns are labeled from A to IV (256 columns), providing a large grid of cells for data entry.
Each cell can contain a value, formula, or function. Cell references identify the location of cells and can be relative, absolute, or mixed references.
Cell Reference Types:
- Relative Reference: Changes when copied to another cell (e.g., A1).
- Absolute Reference: Fixed reference using $ signs (e.g., $A$1).
- Mixed Reference: Either row or column fixed (e.g., $A1 or A$1).
Keyboard shortcuts and mouse operations help navigate and operate within the worksheet efficiently.
Practice Set:
- Explain the difference between relative, absolute, and mixed cell references with examples.
- List keyboard shortcuts for moving around the worksheet.
- Describe the structure of rows and columns in Excel 2007.
Answer Key:
- Relative references adjust when copied; absolute references remain fixed; mixed references fix either row or column.
- Arrow keys move one cell; Ctrl+Home moves to A1; Ctrl+End moves to last cell with data.
- Excel 2007 has 65,536 rows and 256 columns labeled A to IV.
Quick Reference: Cell References: Relative, Absolute, Mixed; Rows: 1-65536; Columns: A-IV
Glossary: Cell Reference, Relative Reference, Absolute Reference, Mixed Reference
Formulas and Functions
A formula is a mathematical calculation entered in a cell, starting with an equal sign (=). It can include cell references, arithmetic operators, and functions.
Functions are predefined formulas that perform specific calculations, such as SUM(), AVERAGE(), and COUNT(). Functions take arguments, which can be cell ranges or values.
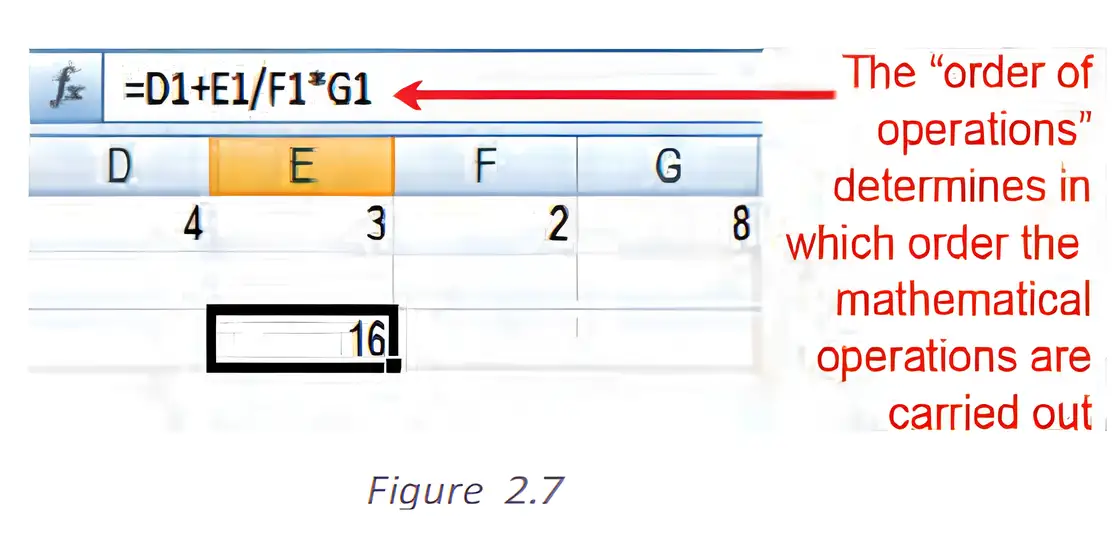
Excel follows the order of operations (PEMDAS/GEMS) when evaluating formulas: parentheses, exponents, multiplication/division, addition/subtraction.
Common Functions:
- SUM(range): Adds all numbers in the range.
- AVERAGE(range): Calculates the mean of numbers in the range.
- COUNT(range): Counts numeric entries in the range.
Practice Set:
- Write a formula to calculate the total of cells B1 to B5.
- Explain the difference between a formula and a function.
- Calculate the result of =D1+E1/F1*G1 given D1=4, E1=3, F1=2, G1=8.
Answer Key:
- =SUM(B1:B5) adds values in cells B1 to B5.
- A formula is a user-defined calculation; a function is a predefined formula.
- Result is 16 (3/2=1.5, 1.5*8=12, 4+12=16).
Quick Reference: Formulas start with =; Functions like SUM(), AVERAGE(), COUNT()
Glossary: Formula, Function, Argument, Order of Operations
Naming Ranges and Conditional Functions
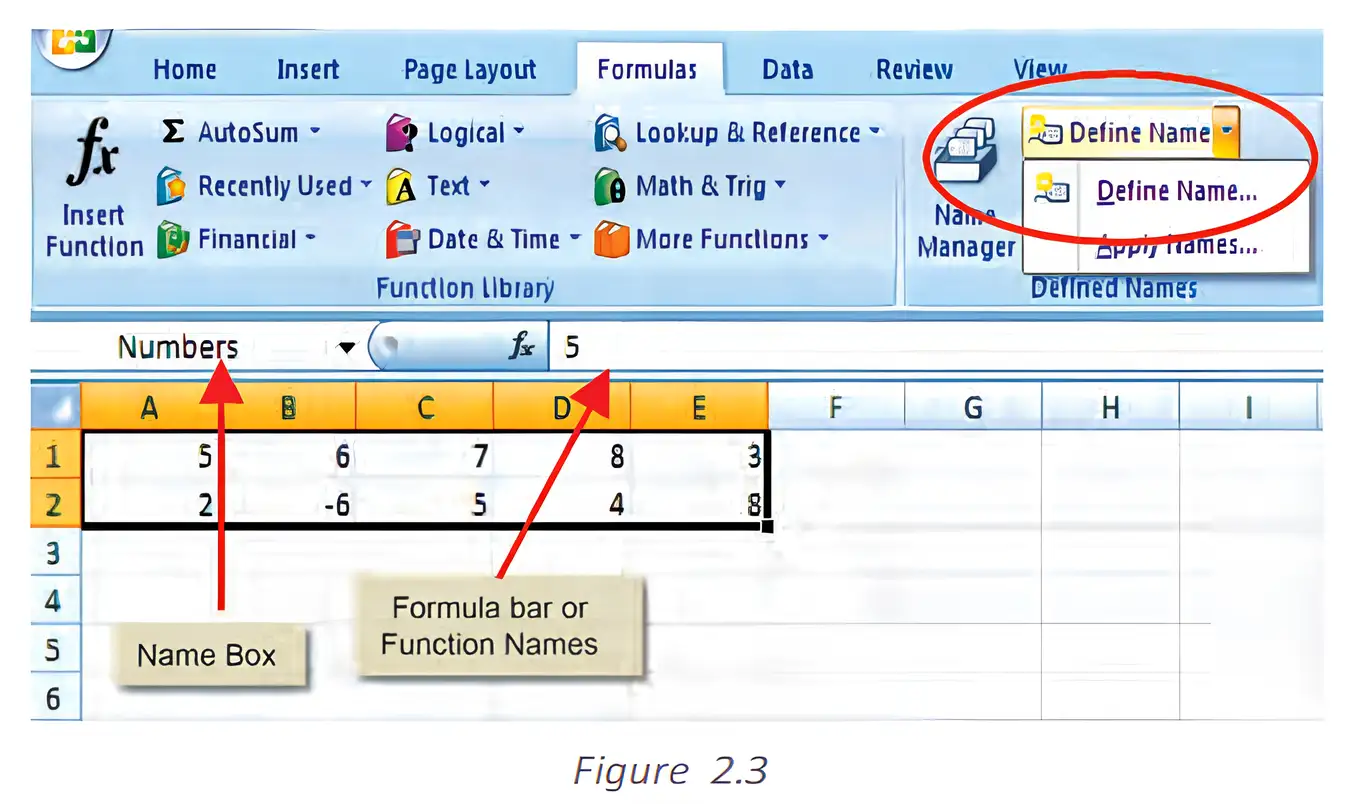
Naming ranges allows assigning a descriptive name to a cell range, making formulas easier to read and manage.
Example: Naming cells B1:F1 as "Numbers" allows using =SUM(Numbers) instead of =SUM(B1:F1).
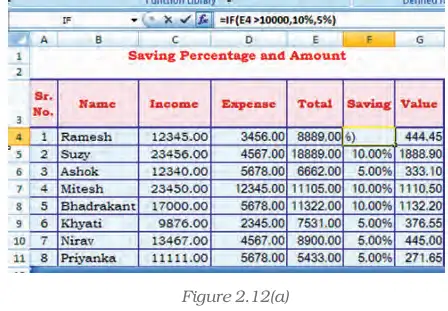
Conditional functions like IF() return values based on logical tests.
IF Function Syntax: IF(logical_test, value_if_true, value_if_false)
Example: =IF(A1<20, "Yes", "No") returns "Yes" if A1 is less than 20, otherwise "No".
Nested IF functions allow multiple conditions to be tested sequentially.
Practice Set:
- Create a named range and use it in a SUM formula.
- Write an IF function to check if a value is greater than 100.
- Explain nested IF with an example.
Answer Key:
- Named range "Numbers" for B1:F1; formula =SUM(Numbers) sums the range.
- IF(A1>100, "High", "Low") returns "High" if A1>100, else "Low".
- Nested IF checks multiple conditions, e.g., =IF(E2<55, "Fail", IF(E2<91, "C Grade", "B Grade"))
Quick Reference: Named Ranges, IF(), Nested IF()
Glossary: Named Range, IF Function, Logical Test, Nested IF
Useful Functions in Business Applications
Excel provides various categories of functions useful in business, including Date & Time, Mathematical, Text Manipulation, Logical, Lookup & Reference, and Financial functions.
Date and Time Functions:
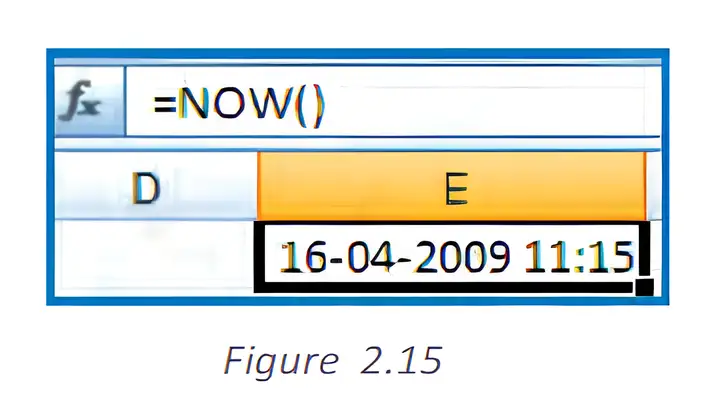
- TODAY(): Returns current date.
- NOW(): Returns current date and time.
- DAY(), MONTH(), YEAR(): Extract day, month, year from a date.
- DATEVALUE(): Converts date text to serial number.
Mathematical Functions:
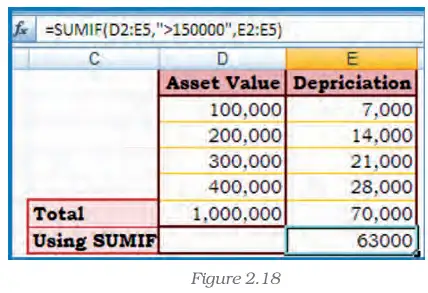
- SUMIF(range, criteria, sum_range): Adds cells meeting criteria.
- ROUND(number, num_digits): Rounds number to specified digits.
- ROUNDUP(), ROUNDDOWN(): Round numbers up or down.
- COUNT(), COUNTA(), COUNTBLANK(), COUNTIF(): Count cells based on conditions.
Text Manipulation Functions:
- TEXT(value, format_text): Converts number to formatted text.
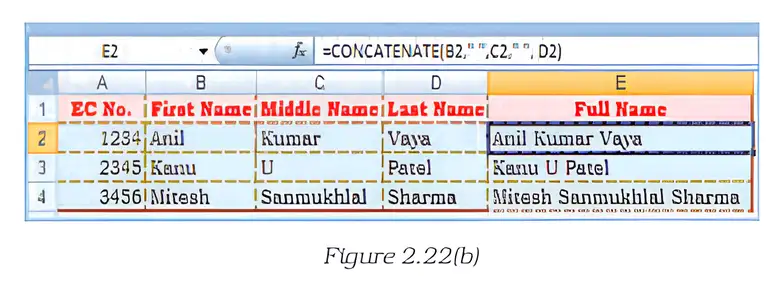
- CONCATENATE(text1, text2,...): Joins multiple text strings.
Logical Functions:
- AND(logical1, logical2,...): Returns TRUE if all arguments are TRUE.
- OR(logical1, logical2,...): Returns TRUE if any argument is TRUE.
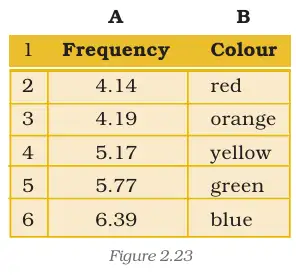
Lookup and Reference Functions:
LOOKUP: Returns a value from a vector or array based on a lookup value.
VLOOKUP: Searches vertically in a table and returns a value from a specified column.
HLOOKUP: Searches horizontally in a table and returns a value from a specified row.
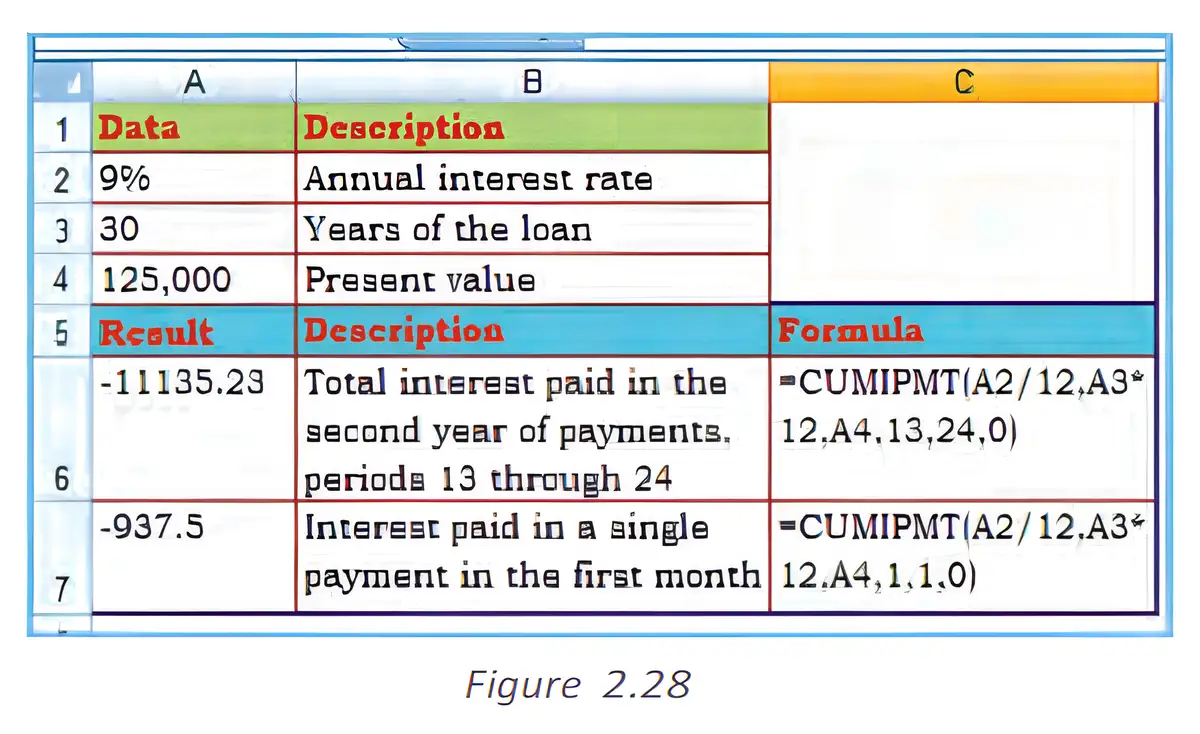
Financial Functions:
- ACCRINT: Calculates accrued interest for securities.
- CUMIPMT: Returns cumulative interest paid between periods.
- PV: Calculates present value of an investment.
- FV: Calculates future value of an investment.
- PMT: Calculates periodic payment for an annuity.
- RATE: Returns interest rate per period.
- NPV: Calculates net present value of an investment.
Practice Set:
- Use TODAY() and NOW() functions to display current date and time.
- Calculate sum of values greater than a specified amount using SUMIF.
- Use VLOOKUP to find employee salary from a table.
- Calculate loan payment using PMT function.
Answer Key:
- TODAY() returns current date; NOW() returns current date and time.
- SUMIF(D2:D5, ">150000", E2:E5) sums depreciation for assets valued over 150,000.
- VLOOKUP(employee_code, table_range, column_index, FALSE) returns exact salary.
- PMT(rate, nper, pv) calculates monthly loan payment.
Quick Reference: Date & Time, Math, Logical, Lookup, Financial Functions
Glossary: TODAY, NOW, SUMIF, VLOOKUP, PMT, NPV
Data Entry, Text Management and Cell Formatting
Data entry in spreadsheets requires accuracy and proper formatting. Excel distinguishes data types such as numeric, text, date, and formulas, aligning them appropriately in cells.
Excel provides features like data fill options, copy-paste, and keyboard shortcuts to facilitate fast and accurate data entry.
Data Validation: Ensures data entered meets specified criteria, preventing errors and maintaining consistency.
Methods include creating drop-down lists, setting limits on values, and using formulas for custom validation.
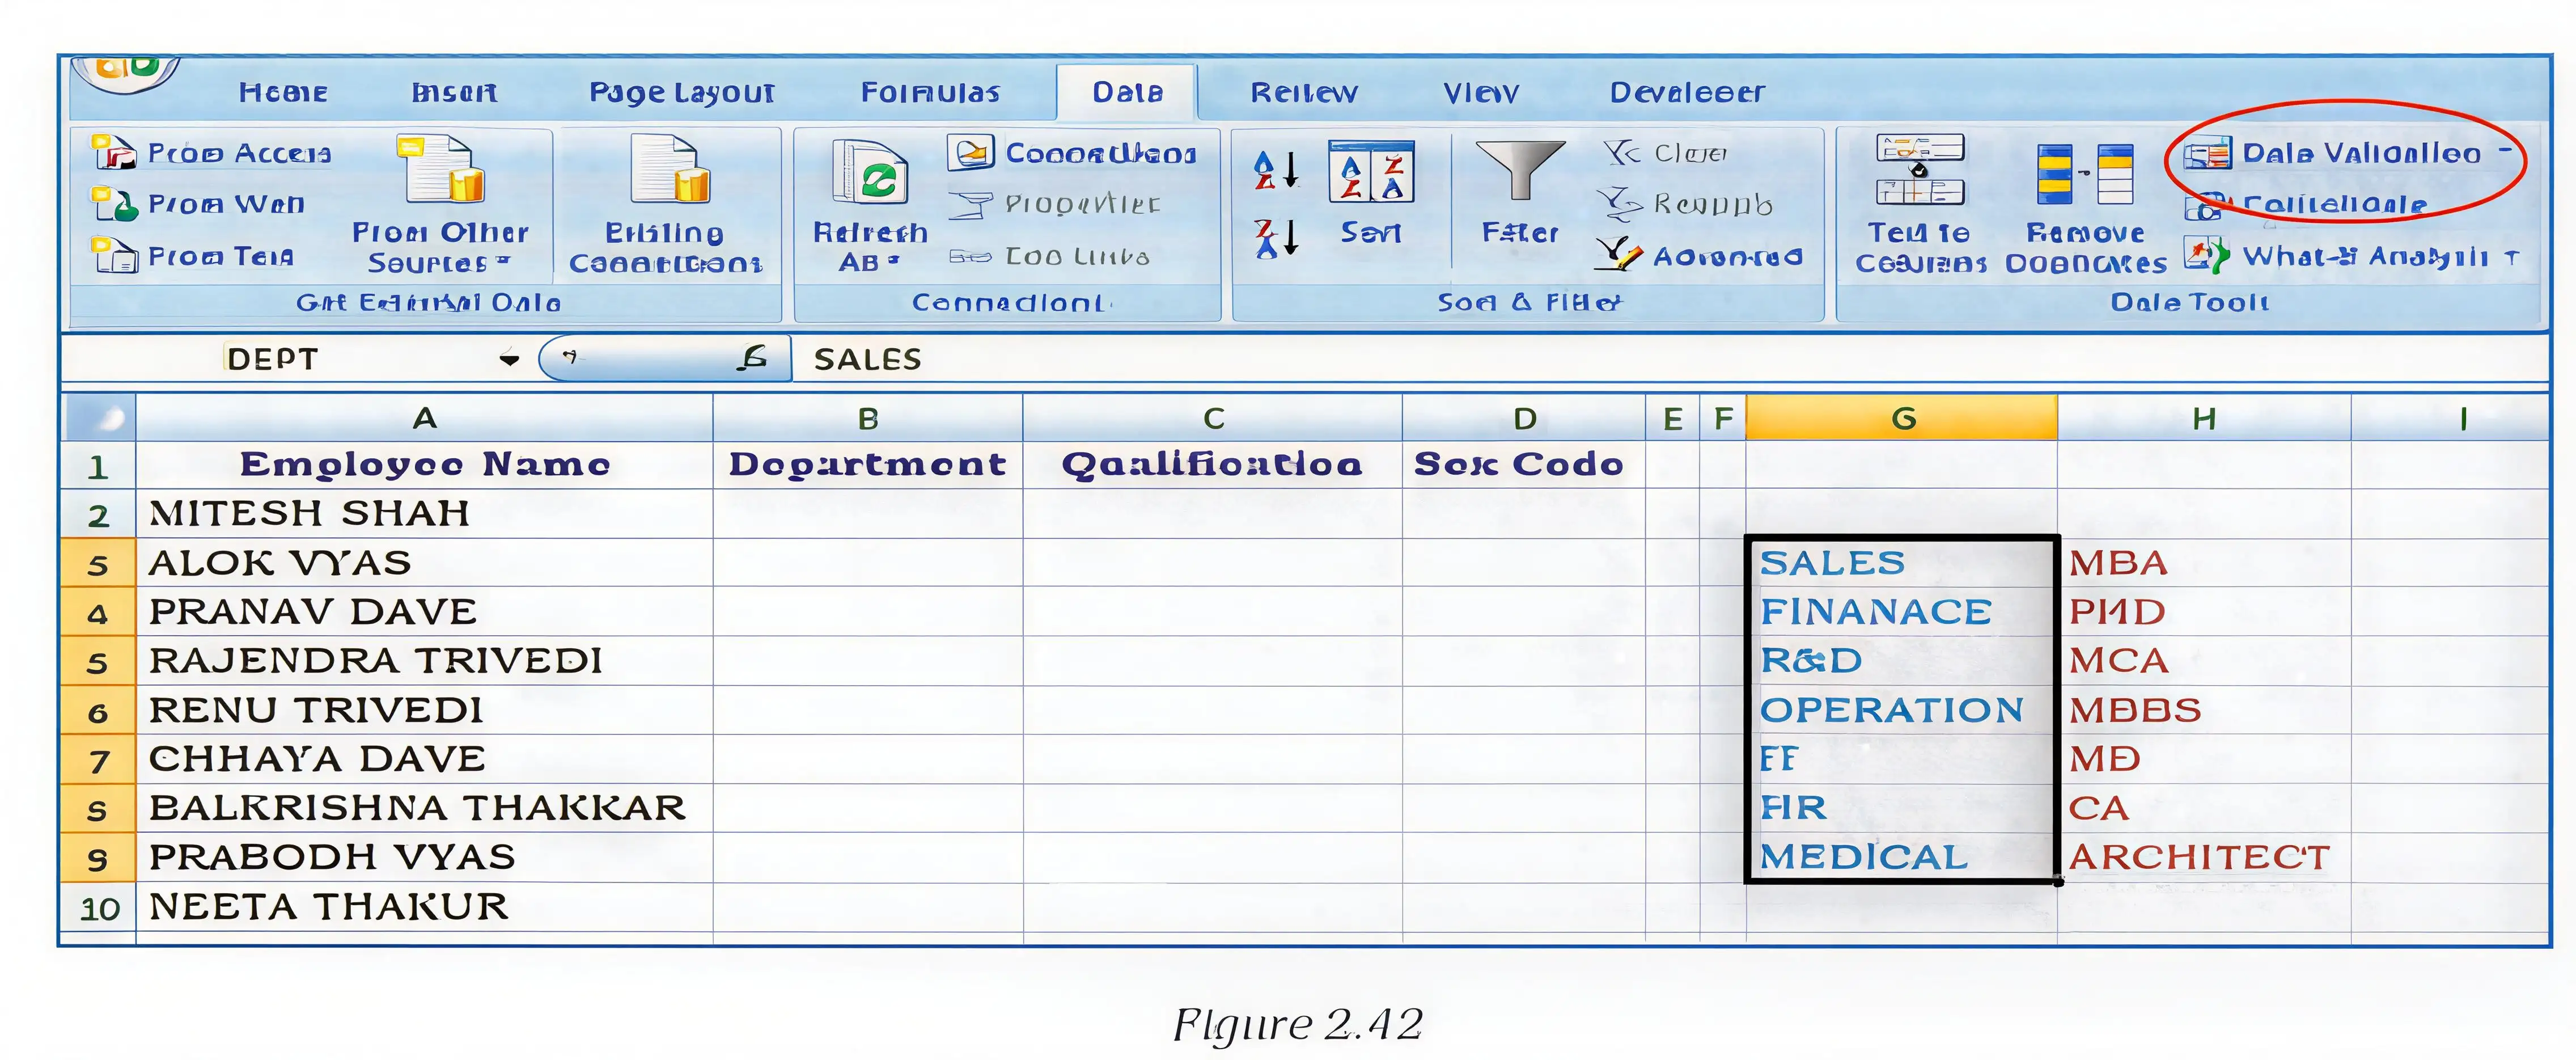
Input messages and error alerts guide users during data entry, improving data quality.
Practice Set:
- Create a drop-down list for department names using data validation.
- Set data validation to restrict age between 18 and 58.
- Use a formula to prevent duplicate entries in a range.
Answer Key:
- Use Data Validation List with named range for departments.
- Set Whole Number validation with minimum 18 and maximum 58 for age.
- Use custom formula with COUNTIF to prevent duplicates.
Quick Reference: Data Validation, Drop-down List, Input Message, Error Alert
Glossary: Data Validation, Drop-down List, Input Message, Error Alert
Data Formatting and Printing
Formatting enhances readability and presentation of spreadsheet data. Excel offers number formatting (currency, percentage, date), text formatting (font, size, color), cell borders, fill colors, and conditional formatting.
Conditional formatting highlights cells based on criteria, using color scales, data bars, and icon sets to visualize data trends and exceptions.
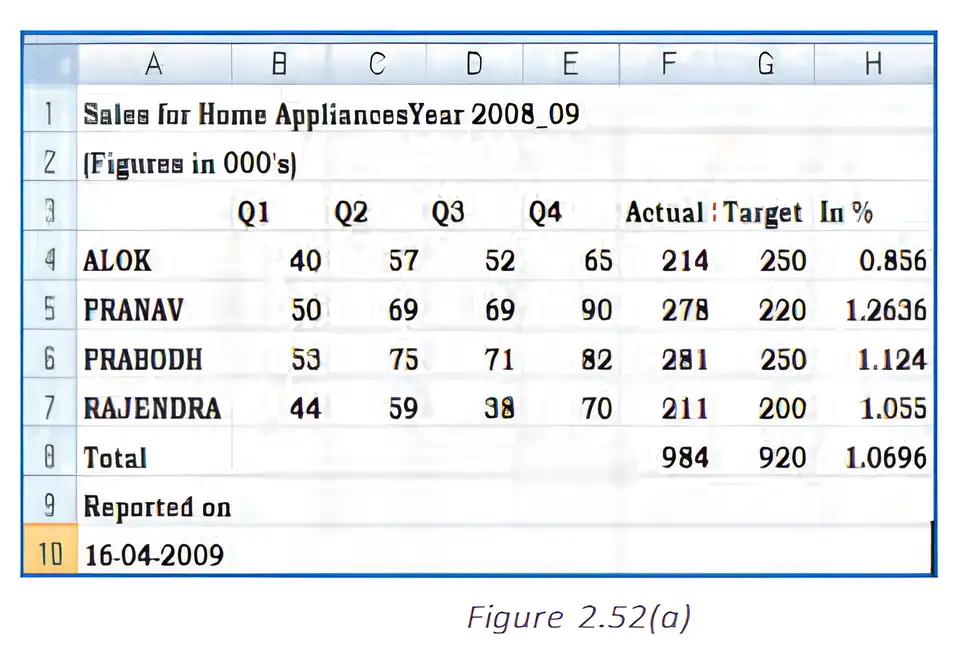
Printing options include setting print areas, printing selected ranges, multiple ranges, and printing entire worksheets or workbooks.
Headers and footers can be added for descriptive information on printed pages.
Practice Set:
- Format a range of cells as currency with zero decimal places.
- Apply conditional formatting to highlight sales above a target.
- Set print area for a specific range and print selected cells.
Answer Key:
- Use Format Cells dialog to set currency format with zero decimals.
- Use Conditional Formatting > Highlight Cells Rules > Greater Than.
- Set print area via Page Layout > Print Area > Set Print Area.
Quick Reference: Number Formatting, Conditional Formatting, Print Area
Glossary: Number Format, Conditional Formatting, Print Area, Header, Footer
Preparation of Reports Using Pivot Table
Pivot Tables provide interactive summary reports from large data sets, allowing users to analyze data by rearranging fields, filtering, and grouping.
Types of data tables include one-variable and two-variable data tables used for what-if analysis.
One-variable data table: Uses one input cell to calculate results for different values.
Two-variable data table: Uses two input cells to generate a matrix of results.
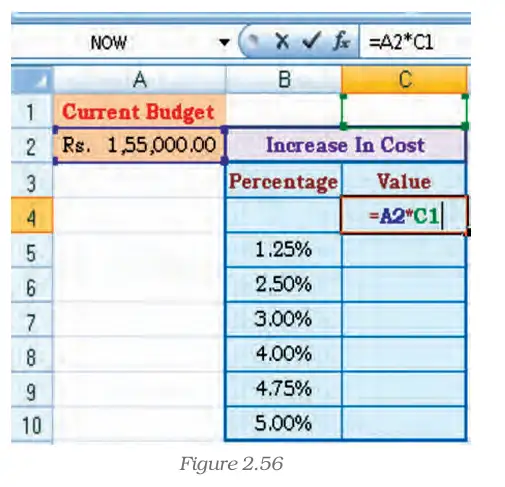
Pivot Tables allow grouping, sorting, and summarizing data with drag-and-drop fields.
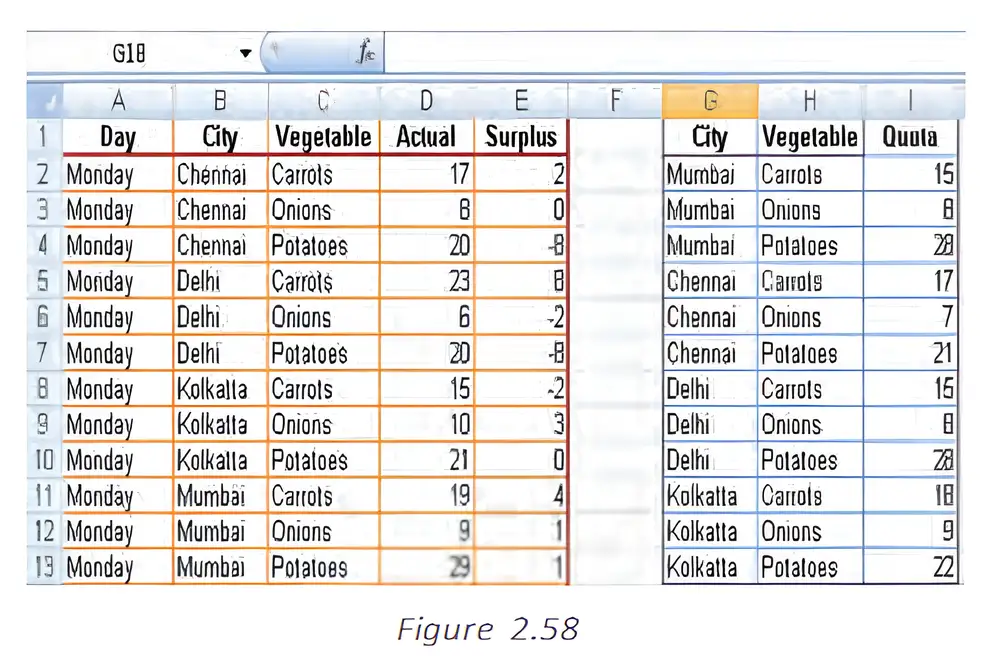
Advantages:
- Quick summarization of large data.
- Interactive data analysis with filtering and grouping.
- Flexible layout changes (pivoting rows and columns).
- Improved readability and presentation.
Practice Set:
- Create a one-variable data table for budget increase calculations.
- Create a two-variable multiplication table.
- Build a Pivot Table report from given sales data.
Answer Key:
- One-variable data table uses formula linked to one input cell and a list of values.
- Two-variable data table uses formula linked to two input cells and two lists of values.
- Pivot Table created by selecting data range, inserting Pivot Table, and arranging fields.
Quick Reference: Pivot Table, One-variable Data Table, Two-variable Data Table
Glossary: Pivot Table, Data Table, What-if Analysis
Common Errors (Messages) in Spreadsheet
Excel displays error messages when formulas cannot be evaluated correctly. Common errors include:
- #####: Column not wide enough or negative date/time.
- #DIV/0!: Division by zero.
- #N/A: Value not available for lookup.
- #NAME?: Unrecognized text in formula.
- #NULL!: Incorrect range intersection.
- #NUM!: Invalid numeric values or iteration errors.
- #REF!: Invalid cell reference.
- #VALUE!: Wrong type of argument or operand.
Excel provides tools for error checking and correction, including tracing precedents and dependents, and using IF functions to handle errors.
Practice Set:
- Identify causes and solutions for #DIV/0! and #N/A errors.
- Explain how to fix #REF! and #VALUE! errors.
- Use IF function to prevent error display in formulas.
Answer Key:
- #DIV/0! occurs when dividing by zero; fix by checking divisor.
- #N/A occurs when lookup value is missing; fix by correcting lookup range.
- #REF! occurs due to invalid cell references; fix by correcting or restoring cells.
- #VALUE! occurs due to wrong argument types; fix by ensuring correct data types.
- Use IF to check conditions and avoid errors, e.g., =IF(B5=0,"",A5/B5).
Quick Reference: Error Types, Causes, Solutions
Glossary: #DIV/0!, #N/A, #REF!, #VALUE!, Error Checking
Summary
• A spreadsheet consists of rows and columns forming cells where data or formulas can be entered.
• Workbooks contain multiple worksheets; each worksheet has cells identified by column letters and row numbers.
• Formulas and functions perform calculations; functions like SUM, IF, VLOOKUP simplify data processing.
• Naming ranges and using conditional functions improve formula readability and decision-making.
• Excel provides various functions for date/time, math, text, logical, lookup, and financial calculations.
• Data entry requires accuracy and validation to maintain data integrity.
• Formatting tools enhance readability and presentation of data.
• Pivot Tables allow interactive data summarization and analysis.
• Common errors have specific causes and solutions; Excel offers tools to identify and correct them.