CLASS 12-COMMERCE . ACCOUNTANCY . COMPANY ACCOUNTS AND ANALYSIS OF FINANCIAL ACCOUNTS . ANALYSIS OF-FINANCIAL-STATEMENTS
Chapter 4 : Analysis of Financial Statements
Ch 4
ACCOUNTANCY
CLASS 12-COMMERCE
Analysis of Financial Statements
Analysis of financial statements implies a thorough, systematic, comprehensive, and critical examination of the information contained in the financial statements. The purpose is to understand the financial data better, draw meaningful conclusions, take planned steps towards development, and secure the future of the organization.
Key Definitions / Features:
- Systematic examination of financial data.
- Helps in decision making and planning.
- Focuses on profitability, liquidity, and financial health.
Example: A company analyzing its balance sheet and income statement to assess profitability and financial position over the years.
Practice Set:
- Level 1: Define financial statement analysis.
- Level 2: Explain the importance of analyzing financial statements for management.
- Level 3: Discuss how financial statement analysis helps in decision making for investors and creditors.
Answer Key:
1. Financial statement analysis is the process of examining financial statements to understand the financial position and performance of a business.
2. It helps management assess profitability, liquidity, and solvency to guide strategic decisions.
3. Investors and creditors use analysis to evaluate earning capacity and creditworthiness.
Quick Reference: Analysis = Examination + Interpretation + Decision Making.
Glossary: Financial Statements - Reports showing financial position and performance.
Objectives of Financial Statements Analysis
The main objectives of financial statement analysis are:
- To present financial data in a simplified and understandable form for meaningful conclusions.
- To assess profitability and operational efficiency of the firm and its departments.
- To ascertain the relative importance of different components of financial position such as assets, liabilities, and owners' equity.
- To facilitate intra-firm and inter-firm comparisons.
- To identify causes for changes in profitability or financial position.
- To assess future trends, aiding forecasting and budget preparation.
Practice Set:
- Level 1: List any three objectives of financial statement analysis.
- Level 2: Explain how financial statement analysis helps in forecasting.
- Level 3: Discuss the role of financial statement analysis in inter-firm comparison.
Answer Key:
1. Simplify financial data, assess profitability, identify causes of change.
2. By analyzing past trends, it helps predict future financial performance.
3. It enables comparison of financial health and performance between firms.
Quick Reference: Objectives focus on simplification, assessment, comparison, and forecasting.
Glossary: Forecasting - Predicting future financial outcomes.
Importance of Financial Statement Analysis
Financial statement analysis is important for various stakeholders:
- Management: Helps assess profitability, liquidity, solvency, and guides strategic decisions and corrective actions.
- Investors: Assists in evaluating earning capacity, growth prospects, and investment safety.
- Creditors: Evaluates liquidity and solvency for lending decisions.
- Government: Uses analysis for taxation and price regulation decisions.
- Customers: Assesses business stability and longevity.
- Employees: Evaluates company progress for decisions on bonuses, wages, and job security.
Practice Set:
- Level 1: Name two stakeholders who benefit from financial statement analysis.
- Level 2: Explain how creditors use financial statement analysis.
- Level 3: Discuss the importance of financial statement analysis for employees.
Answer Key:
1. Management and investors.
2. Creditors assess liquidity and solvency to decide on lending.
3. Employees evaluate company progress for bonuses and job security.
Quick Reference: Stakeholders use analysis for decision making.
Glossary: Liquidity - Ability to meet short-term obligations.
Limitations of Financial Statements Analysis
Despite its usefulness, financial statement analysis has limitations:
- Ignores qualitative information such as management quality, labor force, and public relations.
- Does not disclose current worth as statements are prepared on historical cost principle.
- Accounting choices may introduce bias in financial statements.
- Different accounting policies across firms make comparisons difficult.
Practice Set:
- Level 1: Mention one limitation of financial statement analysis.
- Level 2: Explain why historical cost principle is a limitation.
- Level 3: Discuss how different accounting policies affect analysis.
Answer Key:
1. Ignores qualitative information.
2. Historical cost does not reflect current market value.
3. Different policies lead to inconsistent data, complicating comparisons.
Quick Reference: Limitations include qualitative neglect, historical cost, bias, and policy differences.
Glossary: Historical Cost Principle - Recording assets at original purchase price.
Tools for Analysis of Financial Statements
Financial statement analysis can be performed using the following tools:
- Comparative Statements (Horizontal Analysis)
- Common-Size Statements (Vertical Analysis)
- Ratio Analysis
- Cash Flow Statement Analysis
Practice Set:
- Level 1: Name two tools used for financial statement analysis.
- Level 2: Differentiate between comparative and common-size statements.
- Level 3: Explain the role of ratio analysis in financial evaluation.
Answer Key:
1. Comparative statements and ratio analysis.
2. Comparative statements compare financial data over time; common-size statements express items as percentages of a base.
3. Ratio analysis evaluates relationships between financial statement items to assess performance.
Quick Reference: Tools include comparative, common-size, ratio, and cash flow analysis.
Glossary: Ratio Analysis - Evaluating financial relationships using ratios.
Comparative Statements (Horizontal Analysis)
Comparative statements compare financial data at two or more points in time to identify changes in financial position and operating results.
Comparative Balance Sheet
According to Faulke, "Comparative Balance Sheet analysis is the study of the trend of some items or group of some comprised items in balance sheets of the same business enterprise on different dates." It shows increases and decreases in absolute and percentage terms for assets, liabilities, and capital.
Format:
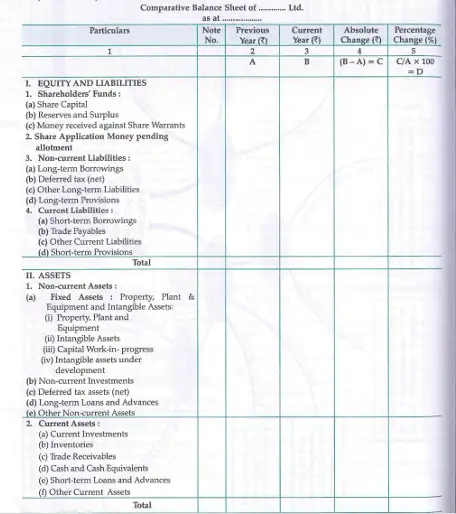
Explanation: The sheet lists equity and liabilities, and assets for previous and current years, calculates absolute and percentage changes to analyze financial progress.
Comparative Statement of Profit & Loss (Income Statement)
This statement reflects operating activities over two or more accounting periods, helping assess operational efficiency and plan future actions.
Format:
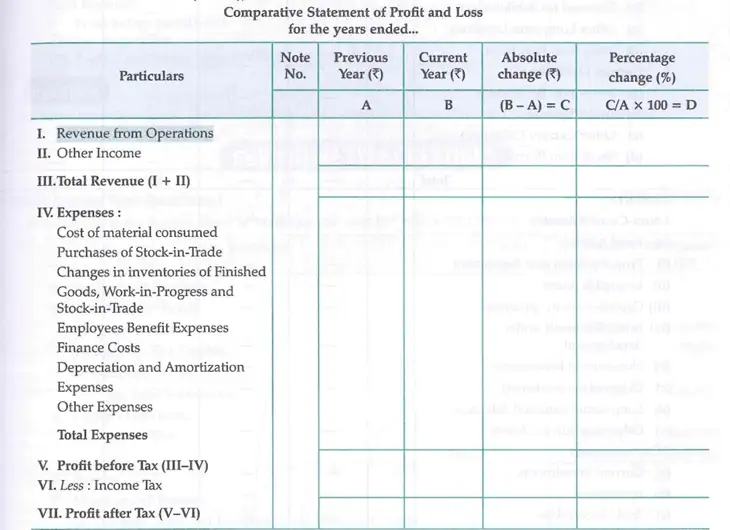
Explanation: It compares revenues, expenses, and profits for two years, showing absolute and percentage changes to understand financial performance.
Practice Set:
- Level 1: What is the purpose of comparative statements?
- Level 2: Explain how a comparative balance sheet is prepared.
- Level 3: Analyze the importance of comparative income statements for management decisions.
Answer Key:
1. To compare financial data over time and identify changes.
2. By listing assets, liabilities, and capital for two years and calculating changes.
3. Helps management assess operational efficiency and plan future strategies.
Quick Reference: Comparative statements show trends and changes.
Glossary: Horizontal Analysis - Comparing financial data across periods.
Common-Size Statements (Vertical Analysis)
Common-size statements express financial statement items as percentages of a base figure, facilitating comparison across firms and periods.
According to Kokler, “Common-Size Statements are accounting statements expressed in percentages of same base rather than rupees.”
Common-Size Balance Sheet
Each item is expressed as a percentage of total assets or total equity and liabilities (100%).
Format:
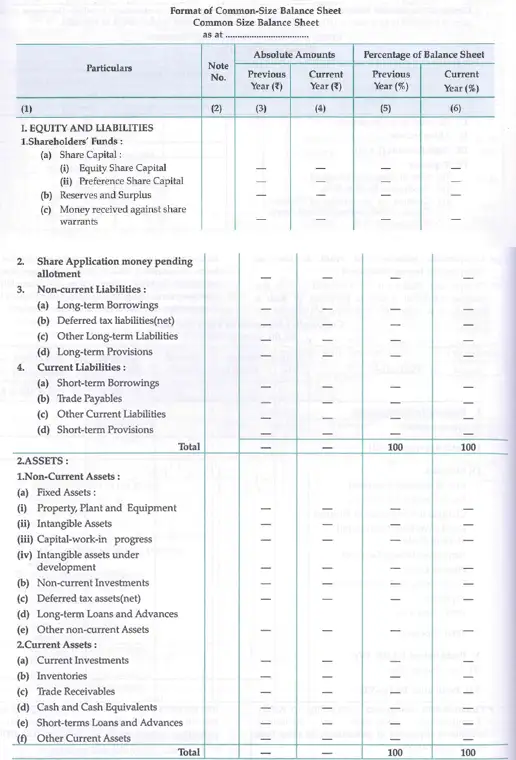
Explanation: Shows absolute values and percentages for previous and current years, helping understand financial structure and changes.
Common-Size Income Statement
All figures are expressed as a percentage of net sales (assumed 100).
Format:
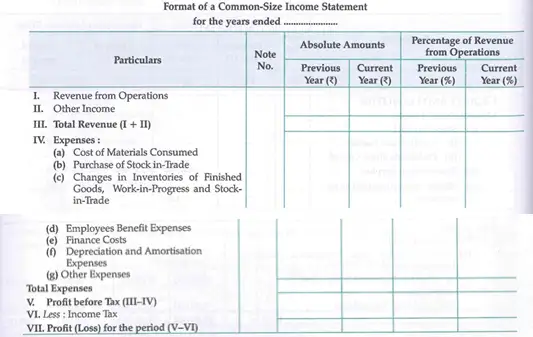
Explanation: Compares revenues and expenses as percentages of net sales over two years to analyze financial performance clearly.
Practice Set:
- Level 1: Define common-size statements.
- Level 2: How does a common-size balance sheet help in analysis?
- Level 3: Discuss the advantages of common-size income statements.
Answer Key:
1. Statements expressing items as percentages of a base.
2. Helps compare financial structure over time or between firms.
3. Facilitates understanding of expense and revenue relationships.
Quick Reference: Vertical analysis = percentage of base.
Glossary: Vertical Analysis - Expressing financial data as percentages of a base figure.
Ratio Analysis
Ratio analysis involves calculating and interpreting financial ratios to evaluate a company's performance and financial health.
Key Ratios Include:
- Liquidity Ratios (e.g., Current Ratio)
- Profitability Ratios (e.g., Net Profit Ratio)
- Solvency Ratios (e.g., Debt to Equity Ratio)
- Efficiency Ratios (e.g., Inventory Turnover)
Practice Set:
- Level 1: What is the purpose of ratio analysis?
- Level 2: Calculate current ratio given current assets of ₹2,00,000 and current liabilities of ₹1,00,000.
- Level 3: Interpret a debt to equity ratio of 2:1.
Answer Key:
1. To evaluate financial performance and position.
2. Current Ratio = Current Assets / Current Liabilities = 2,00,000 / 1,00,000 = 2:1
3. The company has twice as much debt as equity, indicating higher financial risk.
Quick Reference: Ratios = Relationships between financial items.
Glossary: Liquidity Ratio - Measures ability to meet short-term obligations.
Cash Flow Statement
The cash flow statement shows the inflows and outflows of cash during an accounting period, classified into operating, investing, and financing activities.
Importance: Helps assess liquidity and cash management.
Practice Set:
- Level 1: Define cash flow statement.
- Level 2: List the three categories of cash flows.
- Level 3: Explain how cash flow analysis helps in financial planning.
Answer Key:
1. Statement showing cash inflows and outflows.
2. Operating, investing, and financing activities.
3. Helps management plan cash requirements and avoid liquidity problems.
Quick Reference: Cash flow = cash in - cash out.
Glossary: Operating Activities - Core business cash flows.
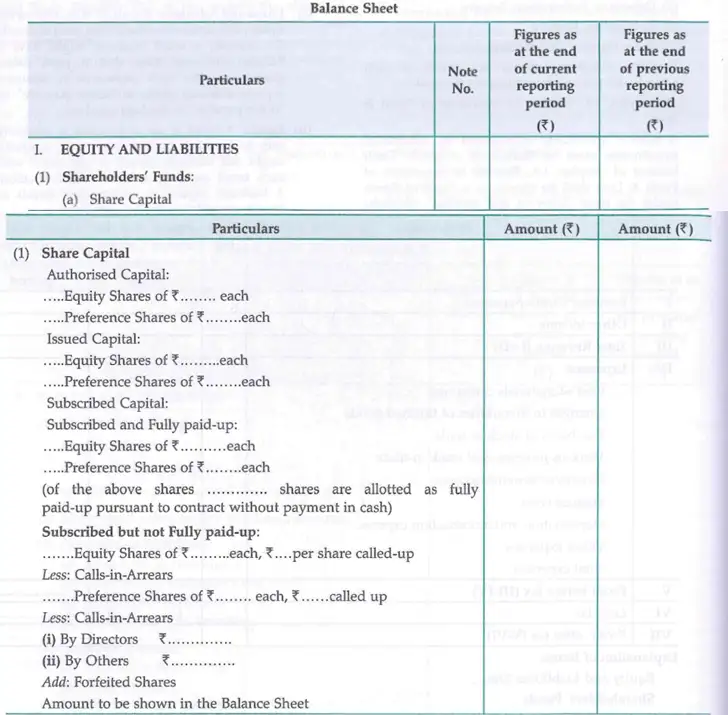
Balance Sheet: Equity and Liabilities - Share Capital
The balance sheet section on equity and liabilities includes share capital, borrowings, provisions, and other liabilities.
Share Capital Categories:
- Authorised Capital: Maximum shares a company can issue.
- Issued Capital: Shares actually issued to shareholders.
- Subscribed Capital: Shares investors agree to buy.
- Paid-up Capital: Money received from shareholders for shares.
- Calls-in-Arrears: Amounts shareholders still owe for their shares.
Practice Set:
- Level 1: Define authorised capital.
- Level 2: Differentiate between issued and subscribed capital.
- Level 3: Explain the significance of calls-in-arrears.
Answer Key:
1. Maximum shares a company can issue.
2. Issued capital is shares given to shareholders; subscribed capital is shares investors agree to buy.
3. Calls-in-arrears represent unpaid amounts, affecting company’s cash flow.
Quick Reference: Share capital = ownership funds.
Glossary: Paid-up Capital - Capital received from shareholders.