CLASS 11-HUMANITIES . ECONOMICS . STATISTICS FOR ECONOMICS . CORRELATION
Chapter 6 : Correlation
Ch 6
ECONOMICS
CLASS 11-HUMANITIES
Correlation
Concept Explanation: Correlation refers to a statistical measure that expresses the extent to which two variables are linearly related. It indicates the degree and direction of association between two data series or variables.
Key Definitions / Features:
- Correlation: A casual connection that exists between two series or groups of data.
- Correlation and Causation: Correlation indicates a relationship but does not imply cause and effect.
- Kinds of Correlation:
- Positive Correlation: Both variables move in the same direction.
- Negative Correlation: Variables move in opposite directions.
- Linear Correlation: Change between variables is in a constant ratio.
- Curvilinear Correlation: Change between variables is not in a constant ratio.
- Simple Correlation: Involves two variables.
- Multiple Correlation: Involves more than two variables.
- Partial Correlation: Relationship between two variables after eliminating effects of others.
- Degree of Correlation:
- Perfect Correlation: Changes in variables are in the same ratio.
- Absence of Correlation: No relationship between variables.
- Limited Degree of Correlation: Unequal changes in variables but in same or opposite directions; coefficient value between 0 and 1 or -1 and 0.
Illustrative Examples:
Example of positive correlation: Increase in income and increase in consumption expenditure.
Example of negative correlation: Increase in price and decrease in quantity demanded.
Practice Set:
- Level 1 – Easy: Define correlation and explain positive and negative correlation with examples.
- Level 2 – Moderate: Differentiate between linear and curvilinear correlation with examples.
- Level 3 – Challenging: Explain partial correlation and provide a real-life scenario where it is applicable.
Answer Key:
- Correlation is a measure of association between two variables.
- Positive correlation means variables move together; negative means they move oppositely.
- Linear correlation has constant ratio changes; curvilinear does not.
- Partial correlation studies relationship after removing effects of other variables.
Quick Reference:
- Correlation measures association, not causation.
- Types: Positive, Negative, Linear, Curvilinear, Simple, Multiple, Partial.
- Degrees: Perfect, Limited, Absence.
Glossary:
- Correlation: Statistical relationship between two variables.
- Positive Correlation: Both variables increase or decrease together.
- Negative Correlation: One variable increases while the other decreases.
- Linear Correlation: Constant ratio of change between variables.
- Curvilinear Correlation: Variable changes not proportional.
- Partial Correlation: Correlation between two variables controlling others.
Methods of Estimating Correlation
Concept Explanation: Various methods are used to estimate the degree and direction of correlation between variables.
Key Methods:
- Scatter Diagram: A graphical representation plotting paired data points to visualize the relationship.
- Karl Pearson’s Coefficient of Correlation: A numerical measure of linear correlation between two variables, denoted by \( r \).
- Spearman’s Rank Difference Method: A non-parametric method using ranks to measure correlation.
Illustrative Examples:
Scatter Diagram: Plotting heights and weights of individuals to observe association.
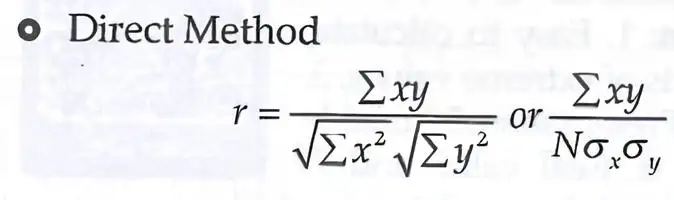
Karl Pearson’s Coefficient: Calculated using the formula:
\[ r = \frac{\sum xy}{\sqrt{\sum x^2 \sum y^2}} = \frac{\sum xy}{\sigma_x \sigma_y} \]
Where \( x \) and \( y \) are deviations from means.
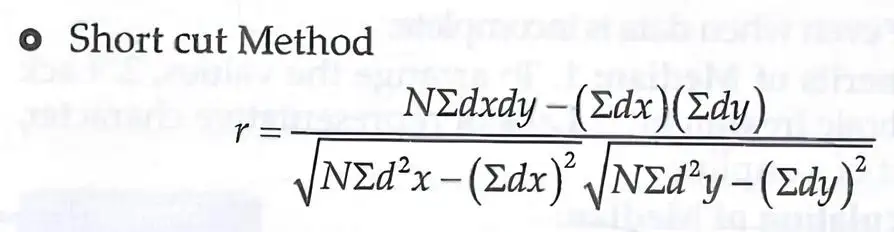
Short Cut Method: Uses deviations from means \( dx, dy \) and sums to calculate \( r \):
\[ r = \frac{n \sum dx dy - (\sum dx)(\sum dy)}{\sqrt{[n \sum dx^2 - (\sum dx)^2][n \sum dy^2 - (\sum dy)^2]}} \]
Spearman’s Rank Difference Method: Calculate rank differences \( d \), square them \( d^2 \), then apply:
\[ \rho = 1 - \frac{6 \sum d^2}{n(n^2 - 1)} \]
For tied ranks, adjust formula accordingly.
Practice Set:
- Level 1 – Easy: Draw a scatter diagram for given data and interpret.
- Level 2 – Moderate: Calculate Karl Pearson’s coefficient for a small data set.
- Level 3 – Challenging: Use Spearman’s rank method to find correlation for ranked data with ties.
Answer Key:
- Scatter diagram shows visual association but no exact value.
- Karl Pearson’s coefficient calculated by formula yields value between -1 and +1.
- Spearman’s method uses ranks and is suitable for ordinal data.
Quick Reference:
- Scatter Diagram: Visual tool.
- Karl Pearson’s Coefficient: Measures linear correlation.
- Spearman’s Rank Method: Non-parametric rank correlation.
Glossary:
- Scatter Diagram: Graph plotting paired data points.
- Karl Pearson’s Coefficient: Numerical measure of linear correlation.
- Spearman’s Rank Correlation: Correlation based on ranks.
Properties and Interpretation of Correlation Coefficient
Concept Explanation: The correlation coefficient \( r \) quantifies the strength and direction of a linear relationship between two variables.
Key Properties:
- Range: \( -1 \leq r \leq +1 \)
- \( r = +1 \): Perfect positive correlation.
- \( r = -1 \): Perfect negative correlation.
- \( r = 0 \): No linear correlation.
- Unitless measure: Independent of units of variables.
- Sensitive to outliers.
- Measures only linear relationships.
- Correlation does not imply causation.
Illustrative Examples:
If \( r = 0.85 \), strong positive linear relationship exists.
If \( r = -0.6 \), moderate negative linear relationship exists.
Practice Set:
- Level 1 – Easy: State the range of correlation coefficient and interpret \( r = 0 \).
- Level 2 – Moderate: Explain why correlation does not imply causation with an example.
- Level 3 – Challenging: Discuss the effect of outliers on correlation coefficient with numerical illustration.
Answer Key:
- Correlation coefficient ranges from -1 to +1.
- \( r = 0 \) means no linear relationship.
- Correlation does not imply causation because other factors may influence variables.
- Outliers can distort \( r \) value significantly.
Quick Reference:
- \( r \) measures strength and direction of linear relationship.
- Range: -1 to +1.
- Interpretation depends on magnitude and sign.
Glossary:
- Correlation Coefficient (r): Numerical measure of linear association.
- Outliers: Extreme values affecting statistical measures.
- Causation: Cause and effect relationship.