Understanding Statistical Dispersion and Its Measures
Concept of Data Spread in Statistics
Defining Dispersion and Its Significance
Dispersion in statistics refers to the degree to which data points in a dataset differ from the average or central value. It provides insight into how data values are scattered or clustered, helping to assess the variability within the dataset. Understanding dispersion is crucial for interpreting the reliability and consistency of data.
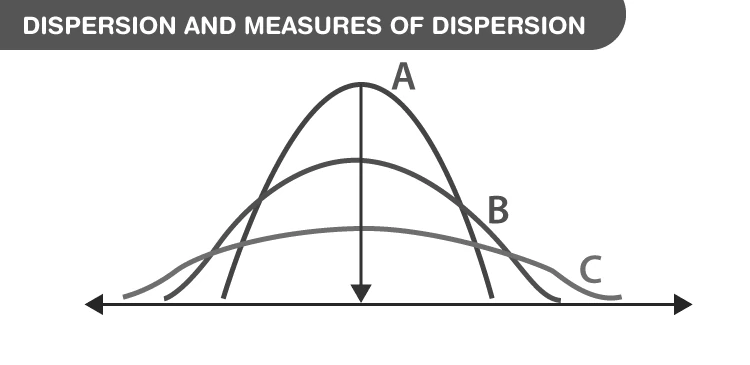
Visual representation of data dispersion around a mean
Example: Interpreting Data Spread
Consider two datasets representing test scores of two classes. If Class A's scores range narrowly around 75, while Class B's scores vary widely from 50 to 100, Class B exhibits greater dispersion. This indicates more variability in Class B's performance compared to Class A.
Absolute Measures of Data Variability
Understanding and Calculating Absolute Dispersion
Absolute measures quantify the spread of data using the same units as the original observations. These measures express variability directly, such as the difference between the highest and lowest values or the average deviation from the mean. Common absolute measures include range, variance, standard deviation, quartile deviation, and mean deviation.
Example: Calculating Variance and Standard Deviation
Given the data set: 2, 4, 6, 8, 10, 12, 14, 16
Step 1: Compute the mean
\[ \text{Mean} = \frac{2 + 4 + 6 + 8 + 10 + 12 + 14 + 16}{8} = \frac{72}{8} = 9 \]
Step 2: Find deviations from the mean and square them
\[ (2-9)^2 = 49, \quad (4-9)^2 = 25, \quad (6-9)^2 = 9, \quad (8-9)^2 = 1, \]
\[ (10-9)^2 = 1, \quad (12-9)^2 = 9, \quad (14-9)^2 = 25, \quad (16-9)^2 = 49 \]
Step 3: Sum the squared deviations
\[ 49 + 25 + 9 + 1 + 1 + 9 + 25 + 49 = 168 \]
Step 4: Calculate variance
\[ \sigma^2 = \frac{168}{8} = 21 \]
Step 5: Determine standard deviation
\[ \sigma = \sqrt{21} \approx 4.58 \]
Relative Measures for Comparing Data Sets
Using Ratios to Assess Dispersion Across Different Data
Relative measures of dispersion allow comparison between datasets with different units or scales by expressing variability as a ratio or percentage. These unitless coefficients facilitate understanding of spread relative to the mean or range. Key relative measures include the coefficient of range, coefficient of variation, coefficient of standard deviation, coefficient of quartile deviation, and coefficient of mean deviation.
Example: Computing Range and Coefficient of Range
Consider the data: 50, 60, 70, 80, 90, 100, 110, 120, 130, 140
Step 1: Identify maximum and minimum values
\[ X_{\max} = 140, \quad X_{\min} = 50 \]
Step 2: Calculate range
\[ \text{Range} = X_{\max} - X_{\min} = 140 - 50 = 90 \]
Step 3: Calculate coefficient of range
\[ C_R = \frac{X_{\max} - X_{\min}}{X_{\max} + X_{\min}} = \frac{140 - 50}{140 + 50} = \frac{90}{190} \approx 0.474 \]
Summary of Key Dispersion Formulas
Measure | Formula | Description |
|---|---|---|
Range | \( R = X_{\max} - X_{\min} \) | Difference between highest and lowest values |
Variance | \( \sigma^2 = \frac{\sum (X_i - \mu)^2}{N} \) | Average of squared deviations from the mean |
Standard Deviation | \( \sigma = \sqrt{\sigma^2} \) | Square root of variance, indicating spread in original units |
Quartile Deviation | \( Q_D = \frac{Q_3 - Q_1}{2} \) | Half the difference between third and first quartiles |
Coefficient of Range | \( C_R = \frac{X_{\max} - X_{\min}}{X_{\max} + X_{\min}} \) | Relative measure comparing range to sum of extremes |
Coefficient of Variation | \( C_V = \frac{\sigma}{\mu} \times 100\% \) | Standard deviation expressed as a percentage of the mean |
Glossary of Statistical Dispersion Terms
Term | Definition |
|---|---|
Dispersion | The extent to which data values spread around a central value |
Range | Difference between the maximum and minimum data points |
Variance | Average of squared deviations from the mean |
Standard Deviation | Square root of variance, indicating spread in original units |
Quartile | Values dividing data into four equal parts |
Quartile Deviation | Half the distance between the first and third quartiles |
Mean Deviation | Average of absolute deviations from a central value |
Coefficient of Variation | Relative measure of dispersion expressed as a percentage |
Coefficient of Range | Ratio of range to the sum of maximum and minimum values |
Absolute Measure | Dispersion expressed in the same units as the data |
Frequently Asked Questions on Dispersion
Why is understanding dispersion essential in statistics?
Dispersion reveals how much data values vary, helping to assess data reliability and the degree of variability around the average.
How can dispersion be calculated effectively?
Dispersion is measured using various metrics such as range, variance, standard deviation, and quartile deviation, depending on the data and analysis needs.
What does a high standard deviation indicate?
A high standard deviation means data points are widely spread out from the mean, indicating greater variability.
How do relative measures differ from absolute measures?
Relative measures express dispersion as ratios or percentages, allowing comparison across datasets with different units or scales, unlike absolute measures which use original data units.
Can dispersion measures be used to compare different datasets?
Yes, relative measures like the coefficient of variation enable meaningful comparisons of variability between datasets with different means or units.