Understanding Average Fixed Cost in Production
Concept of Average Fixed Cost in Business
Defining Average Fixed Cost and Its Behavior
Average Fixed Cost (AFC) represents the portion of total fixed expenses allocated to each unit of output produced by a firm. Unlike variable costs, fixed costs remain constant regardless of production volume in the short term. AFC is calculated by dividing the total fixed cost by the quantity of goods manufactured.
As production scales up, the fixed cost per unit diminishes because the same total fixed cost is spread over more units. Conversely, when output decreases, the AFC per unit rises. This inverse relationship is crucial for understanding cost management in production.
Typical examples of fixed costs include salaries of permanent staff, rent for factory premises, and mortgage payments on equipment. These costs do not fluctuate with production levels in the short run.
Example Problem
A factory incurs a fixed cost of ₹6,000 monthly. If it produces 600 units in a month, determine the average fixed cost per unit. Also, calculate the AFC if production increases to 1,200 units.
Solution:
The formula for average fixed cost is:
\[ \text{AFC} = \frac{\text{Total Fixed Cost}}{\text{Output}} \]
For 600 units:
\[ \text{AFC} = \frac{6000}{600} = 10 \text{₹ per unit} \]
For 1,200 units:
\[ \text{AFC} = \frac{6000}{1200} = 5 \text{₹ per unit} \]
This demonstrates how increasing production lowers the average fixed cost per unit.
Mathematical Representation and Graphical Interpretation
Formula Application and Cost Curve Analysis
The average fixed cost is succinctly expressed as:
\[ \text{AFC} = \frac{\text{Total Fixed Cost (TFC)}}{Q} \]
where \( Q \) is the quantity of output produced. Since total fixed cost remains unchanged in the short run, AFC decreases as \( Q \) increases.
Graphically, the AFC curve slopes downward, reflecting the spreading of fixed costs over a larger number of units. This curve never touches the horizontal axis because fixed costs are never zero.
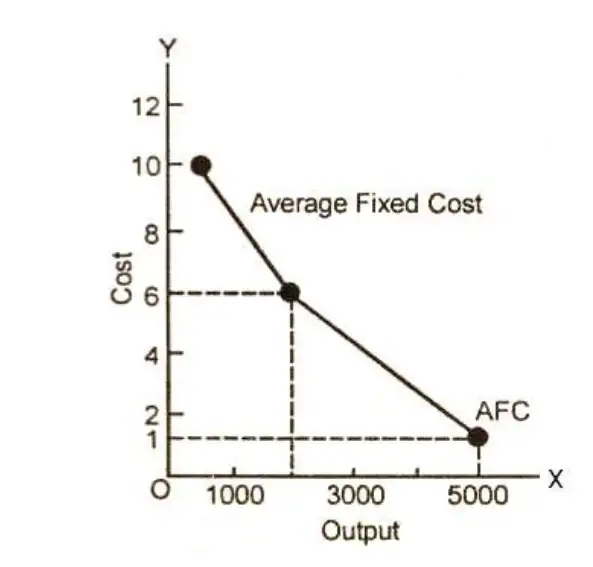
Illustration of the Average Fixed Cost Curve
Illustrative Calculation
A manufacturing unit has a fixed cost of ₹8,000. Calculate the AFC when the output is 400 units and then when it rises to 2,000 units.
Solution:
Using the formula:
\[ \text{AFC}_{400} = \frac{8000}{400} = 20 \text{₹ per unit} \]
\[ \text{AFC}_{2000} = \frac{8000}{2000} = 4 \text{₹ per unit} \]
This confirms the inverse relationship between output and average fixed cost.
Practical Implications and Cost Management
Understanding Fixed Costs in Business Decisions
Recognizing how average fixed cost behaves helps businesses optimize production and pricing strategies. Since fixed costs do not vary with output, increasing production reduces the AFC, improving cost efficiency per unit.
However, it is important to note that fixed costs are only fixed in the short run. Over longer periods, these costs may change due to investments, rent adjustments, or other factors.
Scenario Analysis
A company has a fixed monthly cost of ₹10,000. If it produces 1,000 units, what is the AFC? What happens to AFC if production drops to 500 units?
Solution:
At 1,000 units:
\[ \text{AFC} = \frac{10000}{1000} = 10 \text{₹ per unit} \]
At 500 units:
\[ \text{AFC} = \frac{10000}{500} = 20 \text{₹ per unit} \]
This illustrates how lower production increases the average fixed cost per unit, impacting pricing and profitability.
Quick Reference Summary
Term | Definition | Formula | Behavior |
|---|---|---|---|
Fixed Cost (FC) | Cost that remains constant regardless of output | – | Constant in short run |
Average Fixed Cost (AFC) | Fixed cost per unit of output | \( \text{AFC} = \frac{\text{FC}}{Q} \) | Decreases as output increases |
Output (Q) | Number of units produced | – | Variable |
Total Cost (TC) | Sum of fixed and variable costs | \( \text{TC} = \text{FC} + \text{VC} \) | Varies with output |
Glossary of Key Terms
Term | Meaning |
|---|---|
Average Fixed Cost (AFC) | Fixed cost allocated per unit of output |
Fixed Cost (FC) | Costs that do not change with production level |
Variable Cost (VC) | Costs that vary directly with output |
Total Cost (TC) | Sum of fixed and variable costs |
Output (Q) | Quantity of goods produced |
Short Run | Time period where some costs remain fixed |
Capital | Assets like machinery and buildings used in production |
Cost Curve | Graph showing cost behavior relative to output |
Economies of Scale | Cost advantages gained by increasing production |
Production Function | Relationship between inputs and output |
Frequently Asked Questions
What distinguishes fixed costs from variable costs?
Fixed costs remain unchanged regardless of production volume, while variable costs fluctuate directly with output levels.
Why does average fixed cost decrease as production increases?
Because the total fixed cost is spread over more units, reducing the cost allocated to each individual unit.
Can fixed costs change over time?
Yes, fixed costs are constant only in the short run; over the long run, they can change due to factors like rent adjustments or new investments.
Is average fixed cost ever zero?
No, since fixed costs exist as long as production occurs, AFC approaches zero but never actually reaches it.
How does understanding AFC help businesses?
It aids in pricing decisions and cost control by showing how fixed costs impact per-unit expenses as production scales.