Fundamentals of Microeconomics: Key Concepts and Applications
Understanding the Scope of Microeconomics
Defining Microeconomics and Its Focus
Microeconomics examines the economic behavior and decision-making processes of individual units such as households, consumers, and businesses. Unlike macroeconomics, which analyzes the economy as a whole, microeconomics zooms in on how these smaller entities interact within markets and allocate scarce resources.
This branch often refers to businesses as "firms," encompassing all types of commercial activities. The study centers on how these agents respond to incentives, make choices, and influence market outcomes.
Example Problem
A small bakery decides how many loaves of bread to produce daily based on fluctuating customer demand and ingredient costs. If the bakery notices that increasing the price of bread by 10% reduces the quantity demanded by 15%, what does this indicate about the price sensitivity of its customers?
Solution:
The price elasticity of demand (PED) is calculated as:
\[ \text{PED} = \frac{\%\ \text{change in quantity demanded}}{\%\ \text{change in price}} = \frac{-15\%}{10\%} = -1.5 \]
Since the absolute value of PED is greater than 1, demand is elastic, meaning customers are quite responsive to price changes.
Core Principles Governing Economic Choices
Scarcity, Decision-Making, and Opportunity Cost
At the heart of microeconomics lies the concept of scarcity: limited resources must be allocated among competing uses. Decision-makers face trade-offs, and the opportunity cost represents the value of the next best alternative foregone when a choice is made.
Consumers and producers cannot obtain everything they desire, so they prioritize based on preferences and constraints.
Example Problem
A farmer has 100 hectares of land and must choose between planting wheat or corn. If planting wheat yields a profit of ₹50,000 per hectare and corn yields ₹40,000 per hectare, what is the opportunity cost of planting 1 hectare of wheat?
Solution:
The opportunity cost of planting 1 hectare of wheat is the profit foregone from not planting corn on that hectare, which is ₹40,000.
Thus, choosing wheat means sacrificing ₹40,000 in potential corn profit per hectare.
How Prices Are Determined: The Price Mechanism
Microeconomics investigates how prices emerge from the interaction of supply and demand in markets. Producers supply goods and services, while consumers demand them. The equilibrium price balances these forces, guiding resource allocation efficiently.
This dynamic process is known as the price mechanism, which signals scarcity and consumer preferences to market participants.
Example Problem
In a local market, the demand for mangoes is given by \( Q_d = 120 - 4P \) and the supply by \( Q_s = 2P \), where \( Q \) is quantity in kilograms and \( P \) is price per kilogram in ₹. Find the equilibrium price and quantity.
Solution:
At equilibrium, quantity demanded equals quantity supplied:
\[ 120 - 4P = 2P \]
\[ 120 = 6P \implies P = \frac{120}{6} = 20 \text{ ₹} \]
Substitute \( P = 20 \) into supply equation:
\[ Q_s = 2 \times 20 = 40 \text{ kg} \]
Therefore, the equilibrium price is ₹20 per kg, and the equilibrium quantity is 40 kg.
Demand, Supply, and Market Dynamics
Factors Influencing Consumer Demand
Demand arises from consumers' willingness and ability to purchase goods or services. Several elements affect demand levels, including:
Price of the product
Prices of related goods (substitutes and complements)
Income or earnings of consumers
Preferences and tastes
Expectations about future prices or availability
The demand curve graphically represents the relationship between price and quantity demanded, typically sloping downward.
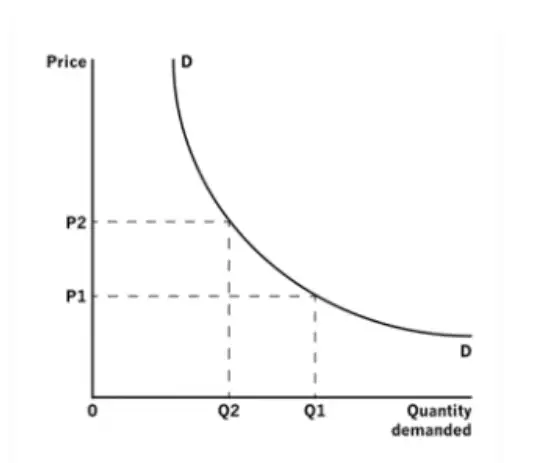
Illustration of a Demand Curve
Example Problem
If the price of a good decreases from ₹50 to ₹40 and the quantity demanded increases from 100 units to 140 units, calculate the price elasticity of demand using the midpoint method.
Solution:
Percentage change in quantity demanded:
\[ \frac{140 - 100}{(140 + 100)/2} \times 100 = \frac{40}{120} \times 100 = 33.33\% \]
Percentage change in price:
\[ \frac{40 - 50}{(40 + 50)/2} \times 100 = \frac{-10}{45} \times 100 = -22.22\% \]
Price elasticity of demand:
\[ \frac{33.33\%}{-22.22\%} = -1.5 \]
The demand is elastic since the absolute value is greater than 1.
Understanding Supply and Its Relationship with Price
Supply represents the quantity of goods or services that producers are willing and able to offer at various prices. Generally, higher prices incentivize producers to supply more, resulting in an upward sloping supply curve.
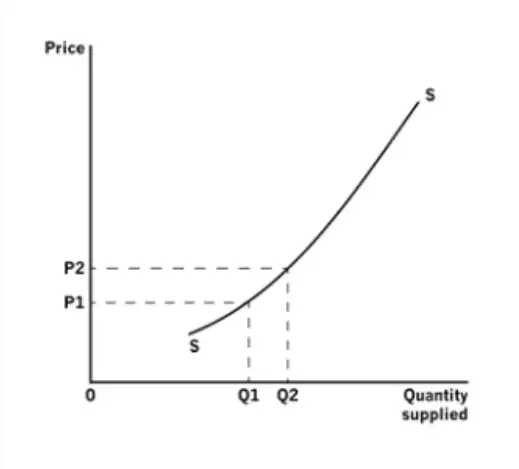
Representation of a Supply Curve
Example Problem
A manufacturer supplies 200 units of a product at ₹30 each and 300 units at ₹40 each. Calculate the price elasticity of supply.
Solution:
Percentage change in quantity supplied:
\[ \frac{300 - 200}{(300 + 200)/2} \times 100 = \frac{100}{250} \times 100 = 40\% \]
Percentage change in price:
\[ \frac{40 - 30}{(40 + 30)/2} \times 100 = \frac{10}{35} \times 100 = 28.57\% \]
Price elasticity of supply:
\[ \frac{40\%}{28.57\%} = 1.4 \]
The supply is elastic as the elasticity is greater than 1.
Market Equilibrium and Its Significance
Market equilibrium occurs when the quantity demanded equals the quantity supplied at a particular price, ensuring no surplus or shortage. This balance point is crucial for efficient resource distribution.
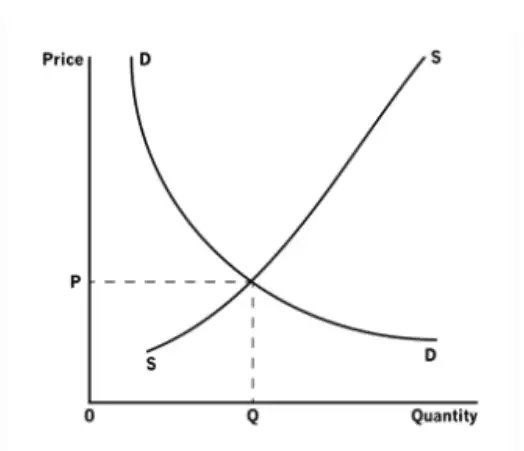
Market Equilibrium Point
Example Problem
Given the demand function \( Q_d = 150 - 3P \) and supply function \( Q_s = 3P \), find the equilibrium price and quantity.
Solution:
Set \( Q_d = Q_s \):
\[ 150 - 3P = 3P \]
\[ 150 = 6P \implies P = \frac{150}{6} = 25 \text{ ₹} \]
Equilibrium quantity:
\[ Q = 3 \times 25 = 75 \]
The market clears at ₹25 with 75 units exchanged.
Market Regulation and Firm Behavior
Government Intervention in Markets
While free markets efficiently allocate many goods, some require government involvement to ensure fair access and prevent market failures. Public goods, which are non-excludable and non-rivalrous, often need such intervention.
Price controls like maximum price limits (price ceilings) are imposed to protect consumers from excessively high prices, especially for essential commodities.
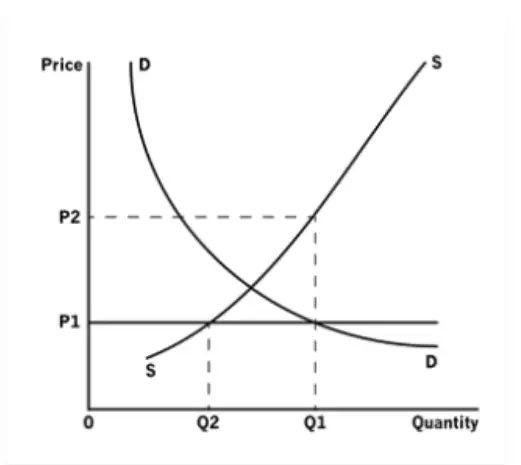
Effect of a Price Ceiling on Market
Example Problem
A government sets a maximum price of ₹15 for a medicine, but the equilibrium price is ₹20. Explain the likely market outcome.
Solution:
The price ceiling is below equilibrium, causing a shortage as quantity demanded exceeds quantity supplied.
Suppliers may reduce production or withdraw from the market.
Consumers may face difficulties obtaining the medicine despite the lower price.
Analyzing Firm Structures and Market Strategies
The theory of the firm explores how businesses organize production and make decisions to maximize profits. It studies different market structures such as perfect competition, monopoly, and oligopoly, and how firms behave under each.
This analysis helps understand pricing, output levels, and efficiency in various industries.
Example Problem
A firm in a competitive market faces a market price of ₹50 per unit. Its total cost for producing 100 units is ₹4,000. Should the firm continue producing if the average variable cost is ₹40 per unit?
Solution:
Price per unit = ₹50
Average variable cost (AVC) = ₹40
Since price > AVC, the firm covers variable costs and contributes to fixed costs, so it should continue production in the short run.
Quick Reference: Summary of Microeconomic Concepts
Concept | Definition | Key Feature |
|---|---|---|
Microeconomics | Study of individual economic units and their decisions | Focus on households, firms, and markets |
Scarcity | Limited availability of resources | Leads to trade-offs and opportunity cost |
Demand | Quantity consumers are willing to buy at various prices | Downward sloping demand curve |
Supply | Quantity producers are willing to sell at various prices | Upward sloping supply curve |
Price Mechanism | Interaction of supply and demand determining prices | Signals scarcity and preferences |
Elasticity | Responsiveness of quantity demanded or supplied to price changes | Elastic if >1, inelastic if <1 |
Equilibrium | Price where quantity demanded equals quantity supplied | Market clears with no surplus or shortage |
Market Intervention | Government actions to regulate markets | Includes price ceilings and public goods provision |
Theory of the Firm | Study of firm behavior and market structures | Analyzes profit maximization and competition |
Opportunity Cost | Value of the next best alternative foregone | Central to decision-making under scarcity |
Glossary of Essential Terms
Term | Meaning |
|---|---|
Demand | Quantity of a good consumers are willing to buy at different prices |
Supply | Quantity of a good producers are willing to sell at different prices |
Elasticity | Measure of responsiveness of quantity demanded or supplied to price changes |
Equilibrium Price | Price at which quantity demanded equals quantity supplied |
Opportunity Cost | Value of the next best alternative given up when making a choice |
Price Mechanism | Process by which prices adjust to balance supply and demand |
Firm | Business organization producing goods or services |
Market Intervention | Government actions to regulate or correct market outcomes |
Scarcity | Limited availability of resources relative to wants |
Public Goods | Goods that are non-excludable and non-rivalrous, often requiring government provision |
Frequently Asked Questions
What distinguishes microeconomics from macroeconomics?
Microeconomics focuses on individual economic units like consumers and firms, while macroeconomics studies the economy as a whole, including aggregate indicators like GDP and inflation.
How does the price mechanism help in resource allocation?
Prices adjust based on supply and demand, signaling scarcity and consumer preferences, which guides producers and consumers to allocate resources efficiently.
What factors cause a shift in the demand curve?
Changes in income, tastes, prices of related goods, expectations, and population can shift the demand curve either left or right.
Why is elasticity important for businesses?
Elasticity helps firms understand how changes in price affect demand or supply, aiding in pricing strategies and revenue optimization.
When is government intervention necessary in markets?
Intervention is needed to correct market failures, provide public goods, regulate monopolies, and protect consumers from unfair practices.