Understanding Gibbs Energy and Ellingham Diagrams in Metal Oxide Reduction
Fundamentals of Gibbs Free Energy and Reaction Spontaneity
Conceptualizing Gibbs Energy in Chemical Reactions
Gibbs free energy is a vital thermodynamic quantity that helps determine whether a chemical reaction will occur spontaneously. It combines the system's enthalpy and entropy changes to predict the direction of a reaction without requiring experimental equilibrium data.
The Gibbs free energy change, \( \Delta G \), is calculated using the relation:
\[ \Delta G = \Delta H - T \Delta S \]
Here, \( \Delta H \) represents the enthalpy change, \( \Delta S \) the entropy change, and \( T \) the absolute temperature in kelvin. A negative \( \Delta G \) indicates a spontaneous process under constant temperature and pressure.
Moreover, Gibbs energy is linked to the equilibrium constant \( K \) of a reaction by the equation:
\[ \Delta G^\circ = -RT \ln K \]
where \( R \) is the universal gas constant and \( \Delta G^\circ \) is the standard Gibbs free energy change. This relationship implies that an exothermic reaction with negative enthalpy tends to have a positive equilibrium constant, favoring product formation.
Example Problem
Consider a reaction with \( \Delta H = -120 \text{ kJ/mol} \) and \( \Delta S = -200 \text{ J/mol·K} \). Calculate the Gibbs free energy change at \( 400 \text{ K} \) and determine if the reaction is spontaneous.
Solution:
First, convert entropy to kJ by dividing by 1000:
\[ \Delta S = -200 \text{ J/mol·K} = -0.200 \text{ kJ/mol·K} \]
Calculate \( \Delta G \):
\[ \Delta G = \Delta H - T \Delta S = -120 - 400 \times (-0.200) = -120 + 80 = -40 \text{ kJ/mol} \]
Since \( \Delta G \) is negative, the reaction proceeds spontaneously at 400 K.
Interpreting the Ellingham Diagram for Metal Oxide Stability
Structure and Significance of the Ellingham Diagram
The Ellingham diagram is a graphical representation that plots the standard Gibbs free energy change of oxide formation reactions against temperature. It is an essential tool for predicting the stability of metal oxides and the feasibility of their reduction.
The general oxidation reaction for metals can be written as:
\[ 2x M(s) + O_2(g) \rightarrow 2 M_x O(s) \]
In this reaction, gaseous oxygen is consumed to form solid metal oxide, leading to a decrease in molecular randomness. Consequently, the entropy change \( \Delta S \) is negative, causing the Gibbs free energy curve to rise with increasing temperature for most metals.
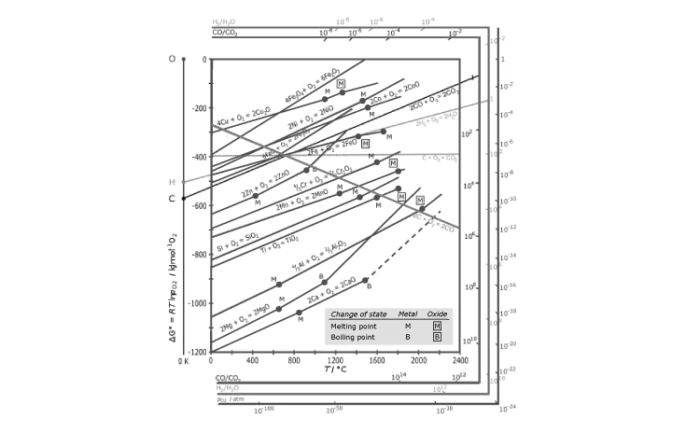
Ellingham diagram illustrating Gibbs free energy changes with temperature
Each line in the diagram typically appears as a straight segment, except where phase changes occur, such as melting. For instance, the curve for zinc oxide shows a distinct slope change at the melting point of zinc.
The position of a metal oxide's line indicates its stability: below the line where \( \Delta G \) is negative, the oxide is stable; above it, the oxide tends to decompose spontaneously.
Example Problem
Given two metals, A and B, with their oxide formation lines intersecting at 900 K on the Ellingham diagram, determine which metal can reduce the oxide of the other above this temperature.
Solution:
Above 900 K, the metal with the lower Gibbs free energy line can reduce the oxide of the metal with the higher line.
If metal A's line lies below metal B's oxide line above 900 K, metal A can reduce metal B's oxide.
This is because the net \( \Delta G \) for the combined reaction becomes negative, favoring reduction.
Applying Gibbs Energy and Ellingham Diagrams to Predict Reduction Reactions
Evaluating Reaction Feasibility Using Combined Gibbs Energies
When multiple reactions occur simultaneously, the overall spontaneity depends on the sum of their Gibbs free energy changes. For two reactions, the combined process is spontaneous only if the total \( \Delta G \) is negative.
This principle is particularly useful in metallurgy, where a reducing agent's ability to extract metal from its oxide depends on the relative Gibbs energies of the involved reactions.
By analyzing the Ellingham diagram, one can identify which metals serve as effective reducing agents for specific metal oxides based on the intersection points and relative positions of their lines.
Illustration of metal oxide reduction using Gibbs energy concepts
Graphical representation of reduction reactions and their Gibbs energy changes
Example Problem
Metal C has a Gibbs free energy of oxide formation line above that of metal D at 1000 K. Can metal D reduce the oxide of metal C at this temperature? Justify your answer.
Solution:
Since metal D's oxide line lies below metal C's at 1000 K, metal D forms a more stable oxide.
This means metal D can reduce metal C's oxide because the net \( \Delta G \) for the reduction reaction is negative.
Therefore, metal D acts as a reducing agent for metal C's oxide at 1000 K.
Quick Reference: Key Points on Gibbs Energy and Ellingham Diagrams
Concept | Definition/Formula | Significance |
|---|---|---|
Gibbs Free Energy (\( \Delta G \)) | \( \Delta G = \Delta H - T \Delta S \) | Predicts spontaneity; negative means spontaneous |
Relation to Equilibrium Constant | \( \Delta G^\circ = -RT \ln K \) | Links thermodynamics to reaction equilibrium |
Ellingham Diagram | Plot of \( \Delta G^\circ_f \) vs. Temperature | Shows stability of metal oxides and reduction feasibility |
Oxidation Reaction | \( 2x M(s) + O_2(g) \rightarrow 2 M_x O(s) \) | Basis for Ellingham diagram lines |
Entropy Change (\( \Delta S \)) | Usually negative for oxide formation | Causes \( \Delta G \) to increase with temperature |
Phase Change Effect | Change in slope on Ellingham diagram | Indicates melting or other phase transitions |
Reduction Feasibility | Based on relative positions of lines | Lower line metal can reduce oxide of upper line metal |
Combined Reactions | Sum of \( \Delta G \) values | Overall reaction spontaneous if total \( \Delta G < 0 \) |
Temperature Dependence | Gibbs energy varies with \( T \) | Reactions may become spontaneous at higher temperatures |
Metal Oxide Stability | Stable below line where \( \Delta G < 0 \) | Determines decomposition or formation tendency |
Glossary of Important Terms
Term | Meaning |
|---|---|
Gibbs Free Energy (\( \Delta G \)) | Thermodynamic potential indicating reaction spontaneity |
Enthalpy (\( \Delta H \)) | Heat content change during a reaction |
Entropy (\( \Delta S \)) | Measure of disorder or randomness in a system |
Equilibrium Constant (K) | Ratio of product to reactant concentrations at equilibrium |
Oxidation | Loss of electrons or combination with oxygen |
Reduction | Gain of electrons or removal of oxygen from a compound |
Ellingham Diagram | Graph showing Gibbs energy changes for oxide formation vs temperature |
Phase Change | Transition between solid, liquid, or gas states |
Reducing Agent | Substance that donates electrons to reduce another species |
Spontaneous Reaction | Reaction that proceeds without external energy input |
Frequently Asked Questions
What does a negative Gibbs free energy indicate?
A negative \( \Delta G \) means the reaction can proceed spontaneously under constant temperature and pressure.
How does temperature affect the Ellingham diagram?
Temperature influences the Gibbs free energy; as temperature rises, the \( \Delta G \) for oxide formation usually increases due to negative entropy change, affecting oxide stability.
Why do Ellingham diagram lines change slope at certain temperatures?
These slope changes correspond to phase transitions like melting, which alter the enthalpy and entropy values of the reaction.
How can the Ellingham diagram be used to select a reducing agent?
A metal whose oxide line lies below another's oxide line at a given temperature can reduce the other metal's oxide, making it an effective reducing agent.
Can a reaction with positive enthalpy be spontaneous?
Yes, if the entropy change is positive and large enough at high temperature, the term \( -T \Delta S \) can make \( \Delta G \) negative, allowing spontaneity.