Comprehensive Overview of Statistical Concepts and Applications
Fundamentals and Scope of Statistical Science
Understanding the Essence of Statistics
Statistics is the discipline concerned with gathering, organizing, analyzing, interpreting, and presenting data. It serves as a branch of applied mathematics that helps in summarizing and making sense of numerical information. Two core principles underpin statistics: uncertainty and variability. These aspects are quantified and explored through statistical methods, often relying on probability theory to assess the likelihood of various outcomes.
By applying statistical techniques, one can extract meaningful insights from data sets, which is essential across numerous fields such as economics, sociology, psychology, and natural sciences.
Example Problem
A researcher collects data on the daily number of visitors to a museum over 30 days. The data shows fluctuations due to weekdays and weekends. Explain how statistics can help understand this variation.
Solution:
Statistics can summarize the data using measures like mean and standard deviation to understand average visitors and variability.
Probability models can assess the likelihood of high or low visitor days.
Graphs such as line charts can visually represent trends and patterns over the 30 days.
Mathematical Foundations in Statistical Analysis
Mathematical statistics applies rigorous mathematical tools to statistical problems. It involves techniques from calculus, linear algebra, and probability theory to develop models and infer conclusions from data. This branch extends beyond simple data description to include hypothesis testing, estimation, and prediction.
For example, stochastic processes and differential equations are used to model complex random phenomena, enhancing the depth of statistical inference.
Example Problem
Consider a dataset where the variance of a population is unknown. Describe how mathematical statistics helps estimate this variance using sample data.
Solution:
Mathematical statistics provides formulas for unbiased estimators of population variance based on sample variance.
Using the sample data, the sample variance \( s^2 \) is calculated as \( s^2 = \frac{1}{n-1} \sum_{i=1}^n (x_i - \bar{x})^2 \).
This estimator accounts for degrees of freedom to provide an accurate estimate of the population variance.
Applications and Reach of Statistical Methods
Statistics is widely applied in diverse domains including social sciences, natural sciences, business, and technology. It enables decision-making based on data, supports scientific research, and facilitates forecasting and quality control.
The scope of statistics encompasses data collection, summarization, analysis, and interpretation, making it indispensable for understanding complex phenomena and guiding policy and strategy.
Example Problem
Explain how statistics can be used in weather forecasting.
Solution:
Historical weather data is analyzed to identify patterns and trends.
Statistical models predict future weather conditions based on observed variables.
Probabilistic forecasts provide likelihoods of events such as rain or storms, aiding preparedness.
Classification and Representation of Data
Types and Characteristics of Data
Data in statistics is broadly categorized into qualitative and quantitative types. Qualitative data describes attributes or qualities, such as colors or categories, while quantitative data represents numerical values that can be measured or counted.
Quantitative data further divides into discrete data, which takes specific fixed values, and continuous data, which can assume any value within a range.
Example Problem
Identify the type of data for the following: The number of cars passing a toll booth each hour.
Solution:
This is quantitative data because it involves counting.
Since the number of cars can only be whole numbers, it is discrete data.
Visualizing Data Through Graphical Tools
Data can be effectively communicated using various graphical representations. Common methods include bar graphs, pie charts, line graphs, pictographs, histograms, and frequency distributions. These visual tools help in identifying patterns, trends, and outliers in data sets.
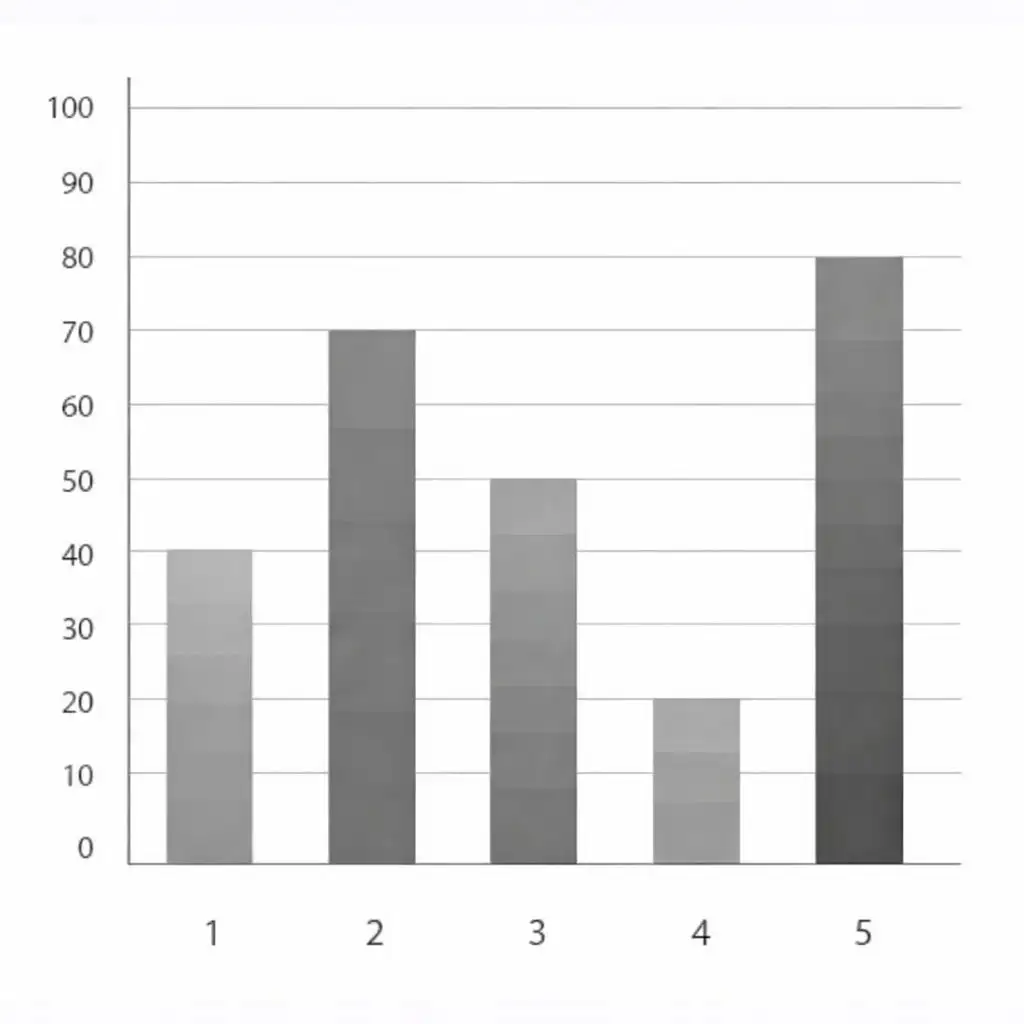
Bar graph depicting categorical data distribution
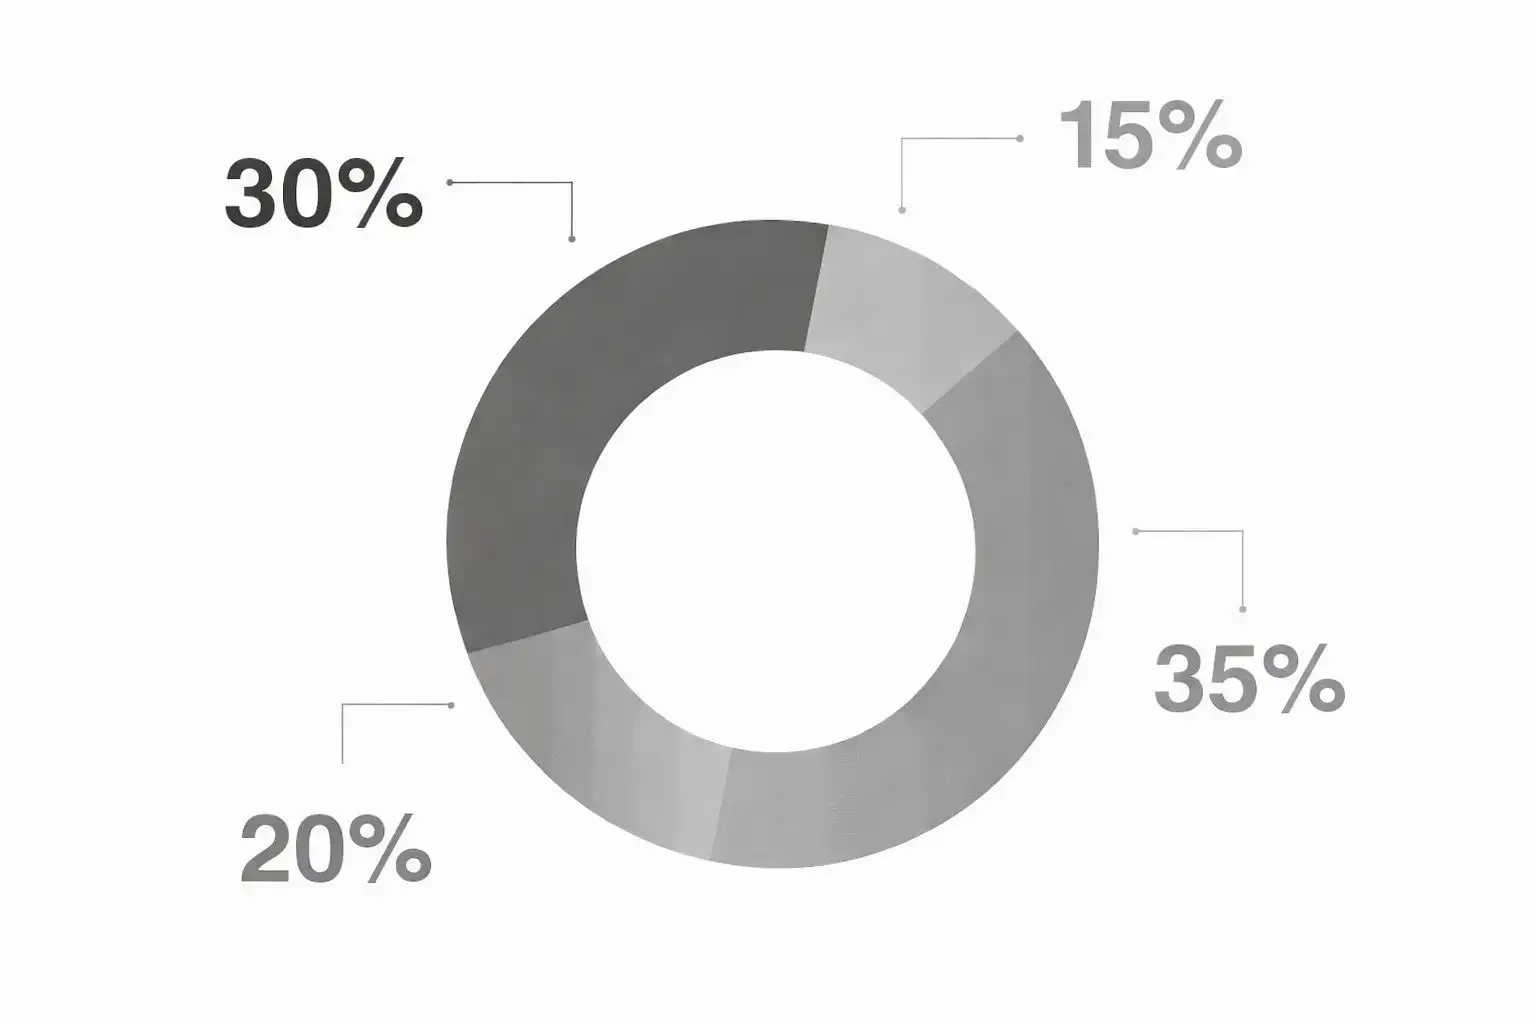
Pie chart representing proportional data
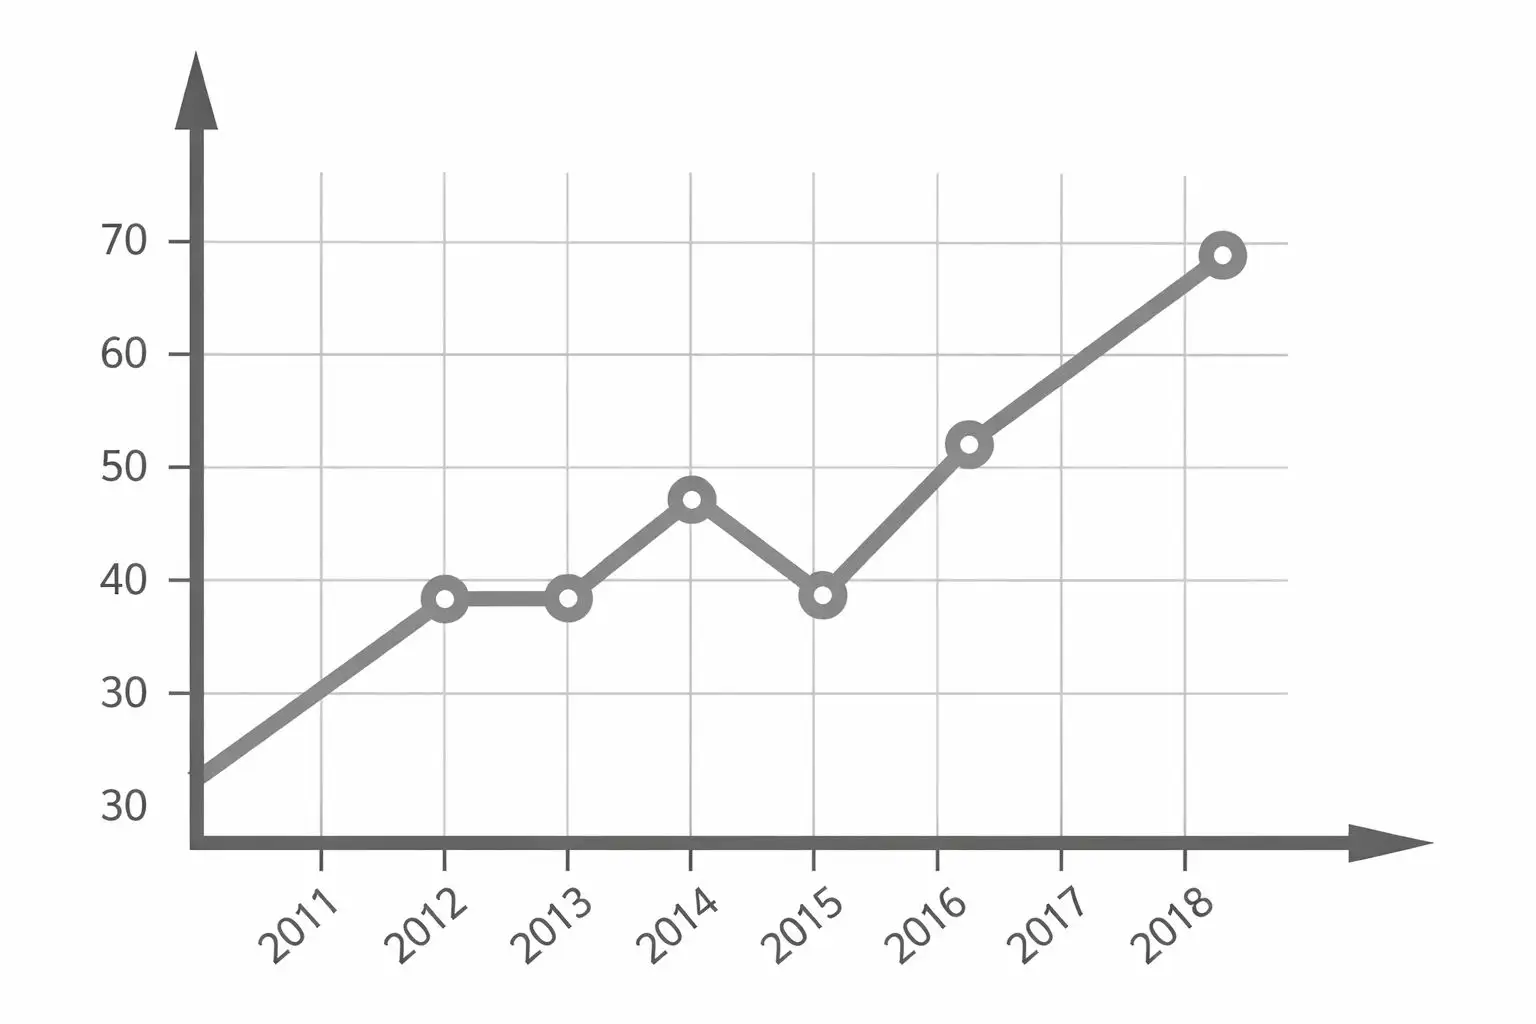
Line graph illustrating data trends
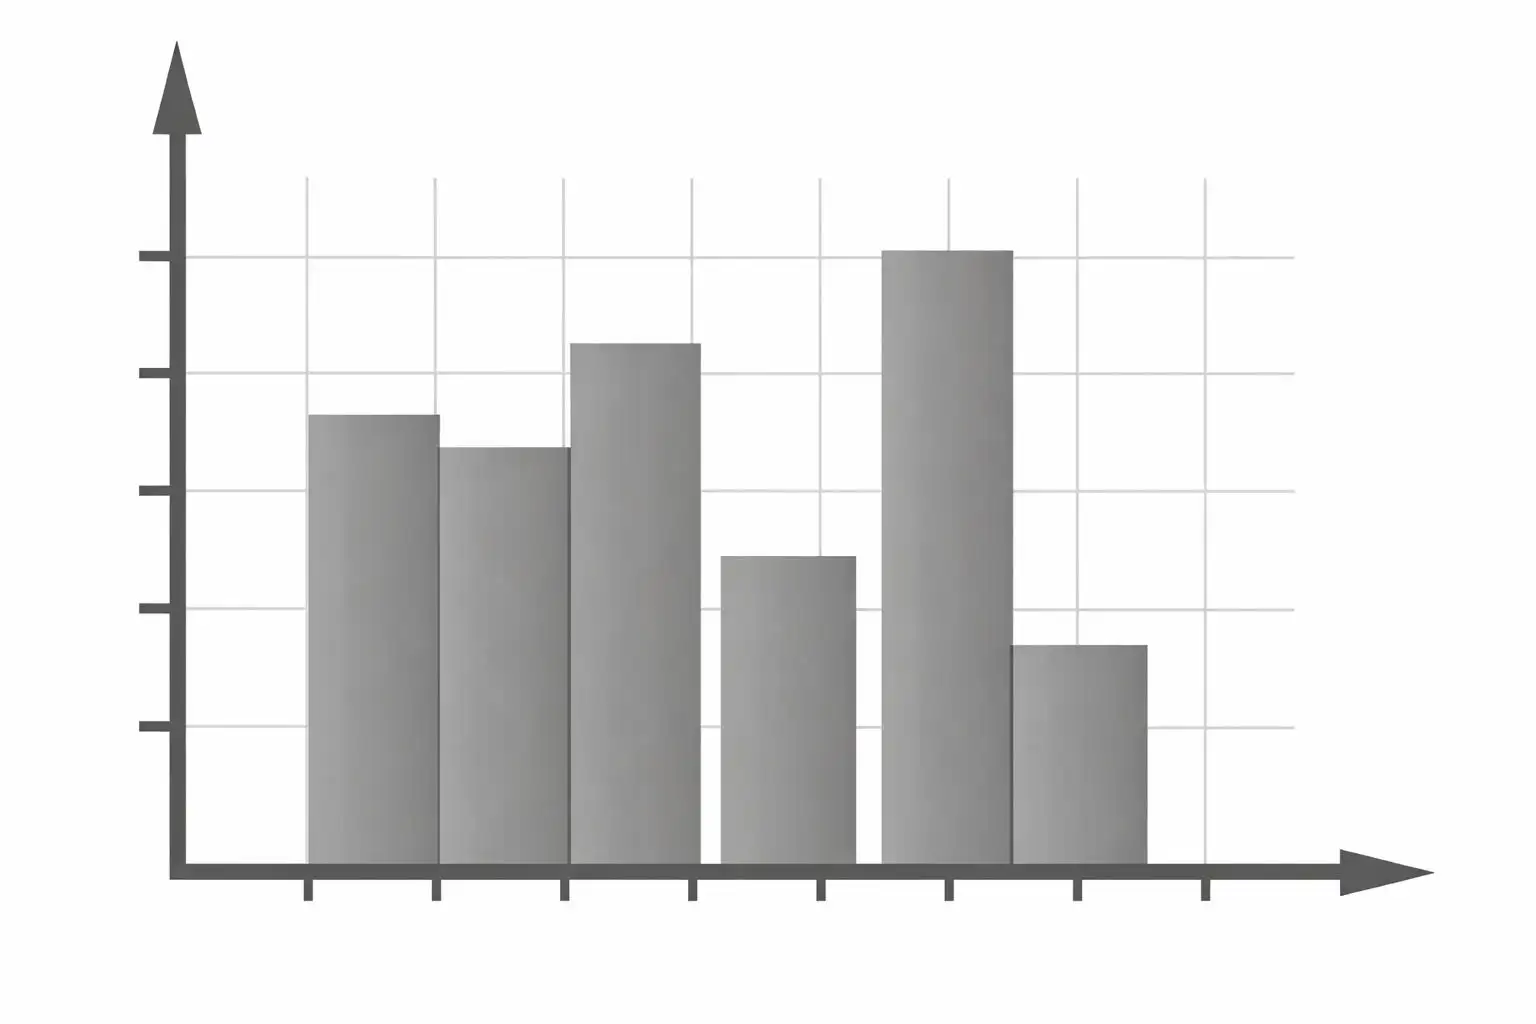
Histogram displaying frequency distribution of data
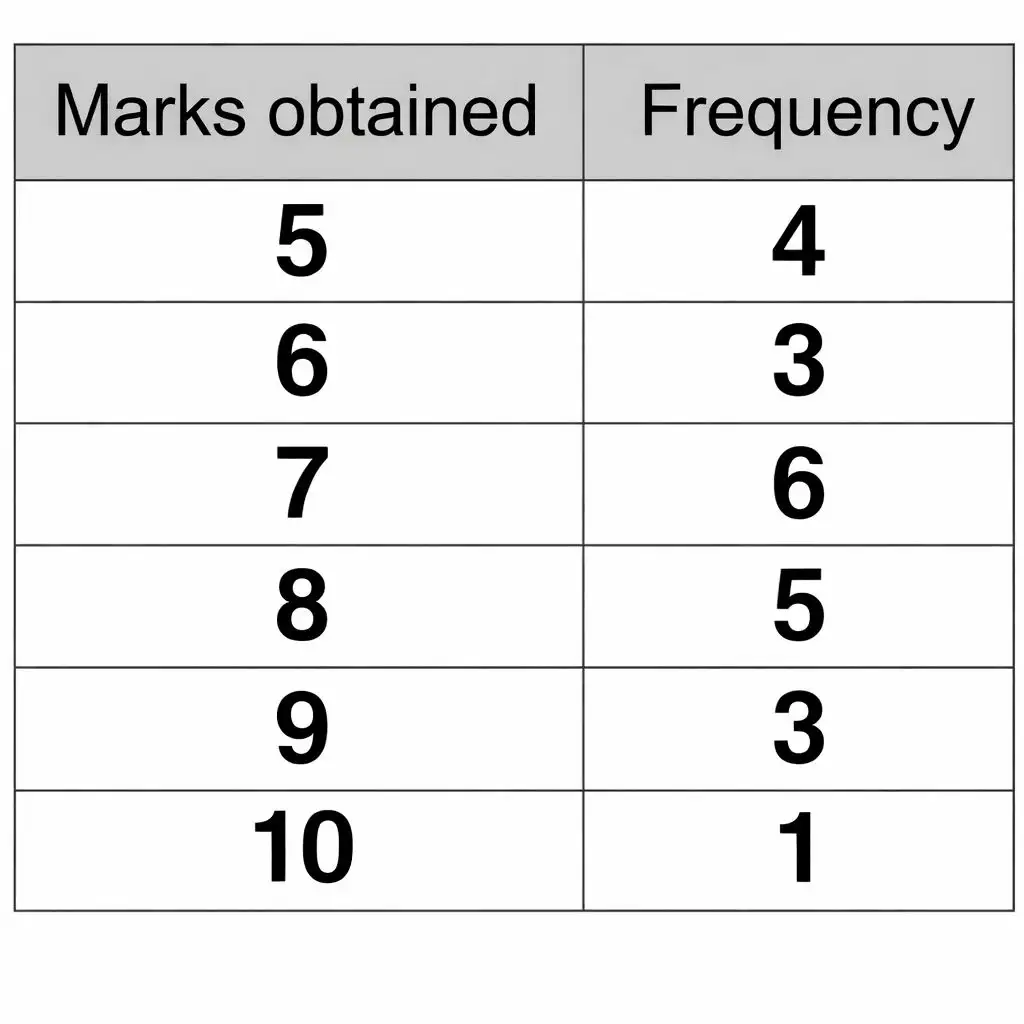
Table summarizing frequency distribution
Example Problem
A survey records the favorite fruit of 100 people: 30 prefer apples, 25 prefer bananas, 20 prefer oranges, and 25 prefer grapes. Suggest an appropriate graphical representation and explain why.
Solution:
A pie chart is suitable to show the proportion of preferences among fruits.
A bar graph can also be used to compare the counts visually.
Both methods help in quickly understanding the distribution of preferences.
Measures of Central Tendency, Dispersion, and Distribution Shape
Central Tendency: Locating the Data Center
Measures of central tendency identify the central or typical value within a data set. The primary measures include the mean, median, and mode. The mean is the arithmetic average, the median is the middle value when data is ordered, and the mode is the most frequently occurring value.
Example Problem
Calculate the mean, median, and mode for the data set: 12, 15, 12, 18, 20, 15, 15.
Solution:
Mean: \( \frac{12 + 15 + 12 + 18 + 20 + 15 + 15}{7} = \frac{107}{7} \approx 15.29 \)
Median: Arrange data as 12, 12, 15, 15, 15, 18, 20; middle value is 15.
Mode: 15 (occurs 3 times, most frequent).
Quantifying Data Spread: Dispersion Measures
Dispersion measures describe how data values are spread around the central tendency. Key metrics include range, variance, standard deviation, quartiles, and coefficients of variation. These help assess data consistency and variability.
The standard deviation \( \sigma \) is the square root of variance \( \sigma^2 \), representing average deviation from the mean.
Example Problem
Given the data set: 8, 10, 12, 14, 16, find the variance and standard deviation.
Solution:
Mean \( \bar{x} = \frac{8 + 10 + 12 + 14 + 16}{5} = 12 \)
Variance \( \sigma^2 = \frac{(8-12)^2 + (10-12)^2 + (12-12)^2 + (14-12)^2 + (16-12)^2}{5} = \frac{16 + 4 + 0 + 4 + 16}{5} = \frac{40}{5} = 8 \)
Standard deviation \( \sigma = \sqrt{8} \approx 2.83 \)
Understanding Skewness and Distribution Shape
Skewness measures the asymmetry of a data distribution. A perfectly symmetrical distribution has zero skewness, while positive skewness indicates a longer right tail and negative skewness a longer left tail. Skewness helps in understanding the nature of data and selecting appropriate statistical methods.
Example Problem
Explain what a positive skewness in income data implies.
Solution:
Positive skewness means most people earn below the average income.
A few individuals with very high incomes pull the mean to the right.
This indicates income inequality within the population.
Advanced Statistical Techniques and Data Analysis Tools
Analysis of Variance (ANOVA) Explained
ANOVA is a statistical method used to compare means across multiple groups to determine if at least one group mean differs significantly. It partitions total variation into components attributable to different sources and tests hypotheses about group differences.
Example Problem
Three different teaching methods are tested on student performance. Scores are collected from three groups. Describe how ANOVA can be used to analyze the data.
Solution:
Calculate the mean score for each group and overall mean.
Compute the variance within groups and between groups.
Use the F-test to determine if differences among group means are statistically significant.
Degrees of Freedom in Statistical Calculations
Degrees of freedom (df) refer to the number of independent values that can vary in an analysis without violating constraints. It is crucial in estimating parameters and conducting hypothesis tests, affecting the shape of sampling distributions.
Example Problem
For a sample of size 15, what is the degrees of freedom when estimating the sample variance?
Solution:
Degrees of freedom \( df = n - 1 = 15 - 1 = 14 \).
This accounts for the estimation of the sample mean used in variance calculation.
Summary and Quick Reference of Key Statistical Formulas
Concept | Formula | Description |
|---|---|---|
Mean | \( \bar{x} = \frac{1}{n} \sum_{i=1}^n x_i \) | Average of all observations |
Median | Middle value in ordered data | Central value separating higher and lower halves |
Mode | Value with highest frequency | Most common observation |
Variance | \( \sigma^2 = \frac{1}{n} \sum_{i=1}^n (x_i - \bar{x})^2 \) | Average squared deviation from mean |
Standard Deviation | \( \sigma = \sqrt{\sigma^2} \) | Measure of data spread around mean |
Coefficient of Variation | \( CV = \frac{\sigma}{\bar{x}} \times 100\% \) | Relative measure of dispersion |
Range | \( \text{Max} - \text{Min} \) | Difference between largest and smallest values |
ANOVA F-statistic | \( F = \frac{\text{Between-group variance}}{\text{Within-group variance}} \) | Tests equality of group means |
Degrees of Freedom | \( df = n - 1 \) | Number of independent values in calculation |
Glossary of Essential Statistical Terms
Term | Definition |
|---|---|
Mean | The arithmetic average of a data set. |
Median | The middle value in an ordered data set. |
Mode | The most frequently occurring value in a data set. |
Variance | The average of squared deviations from the mean. |
Standard Deviation | The square root of variance, indicating data spread. |
Skewness | A measure of asymmetry in a probability distribution. |
ANOVA | Analysis of Variance, a method to compare group means. |
Degrees of Freedom | The number of independent values in a calculation. |
Discrete Data | Data that can take only specific, separate values. |
Continuous Data | Data that can take any value within a range. |
Frequently Asked Questions on Statistical Concepts
What is the primary purpose of statistics?
Statistics aims to collect, analyze, and interpret data to make informed decisions and understand patterns within data sets.
How do descriptive and inferential statistics differ?
Descriptive statistics summarize and describe data features, while inferential statistics use sample data to make generalizations about a larger population.
What is the significance of measures of central tendency?
They provide a central or typical value that represents the entire data set, helping to simplify and understand data.
Why is standard deviation important in data analysis?
Standard deviation quantifies the amount of variation or dispersion in a data set, indicating how spread out the values are from the mean.
How does ANOVA help in comparing multiple groups?
ANOVA tests whether there are statistically significant differences between the means of three or more groups by analyzing variance within and between groups.