Understanding Arithmetic Mean: A Key Measure of Central Tendency
Essentials of Central Tendency and Its Role in Data Analysis
Concept and Importance of Central Tendency
Central tendency refers to statistical techniques that summarize a large set of data by identifying a single representative value. This simplification helps in understanding and interpreting vast amounts of information efficiently. For instance, when you glance at a weather report, the daily temperature is often presented as a single average value, despite fluctuations throughout the day. Similarly, academic performance is often summarized by an overall percentage rather than individual subject scores.
By condensing data into a central value, it becomes easier to analyze trends, compare datasets, and make informed decisions based on the summarized information.
Example: Consider a newspaper reporting the average temperature of a city for the day. Although temperatures vary hourly, the average temperature provides a quick snapshot of the day's climate.
Defining and Calculating the Arithmetic Mean
What Is Arithmetic Mean and How Is It Computed?
The arithmetic mean, commonly known as the average, is the most widely used measure of central tendency. It is calculated by adding all the values in a dataset and dividing the total by the number of values. This provides a balanced central value that represents the dataset.
For a dataset with values \( x_1, x_2, x_3, \ldots, x_n \), the arithmetic mean \( \bar{x} \) is given by:
\[ \bar{x} = \frac{x_1 + x_2 + x_3 + \cdots + x_n}{n} \]
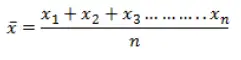
Formula for Arithmetic Mean
When data includes frequencies \( f_1, f_2, f_3, \ldots, f_n \) corresponding to observations \( x_1, x_2, x_3, \ldots, x_n \), the mean is calculated as:
\[ \bar{x} = \frac{f_1 x_1 + f_2 x_2 + f_3 x_3 + \cdots + f_n x_n}{f_1 + f_2 + f_3 + \cdots + f_n} \]
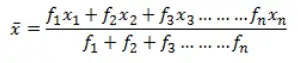
Arithmetic Mean Considering Frequencies
For grouped data, the midpoint (class mark) of each class interval is used to approximate the values. The class mark \( x_i \) for a class interval is calculated as:
\[ x_i = \frac{\text{Lower limit} + \text{Upper limit}}{2} \]

Calculation of Class Mark for Grouped Data
After determining the class marks, the mean is computed using the frequency-weighted average as shown above. This approach is known as the direct method for grouped data.
Practical Applications and Examples of Arithmetic Mean
Calculating Mean from Tabulated Data
Consider a scenario where the marks obtained by 25 students in a science test out of 40 are recorded. The data is grouped into intervals with corresponding frequencies. To find the average score, we calculate the class marks and then apply the frequency-weighted mean formula.
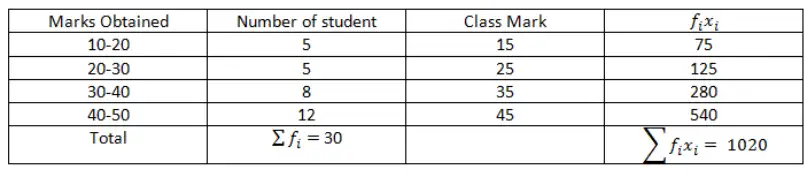
Grouped Marks Data of Students
Solution: Calculate the class marks, multiply each by its frequency, sum these products, and divide by the total number of students.
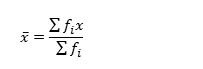
Stepwise Computation of Arithmetic Mean
The average score for the class is 28.4 marks.
Mean of a Sequence of Natural Numbers
To find the average of the first 8 natural numbers, we sum the numbers from 1 to 8 and divide by 8.
Given numbers: 1, 2, 3, 4, 5, 6, 7, 8
Arithmetic Mean \( = \frac{1 + 2 + 3 + 4 + 5 + 6 + 7 + 8}{8} \)
\[ = \frac{36}{8} = 4.5 \]
Thus, the average of the first 8 natural numbers is 4.5.
Determining the Mean of Prime Numbers
Calculate the average of the first 6 prime numbers: 2, 3, 5, 7, 11, and 13.
Sum of primes \( = 2 + 3 + 5 + 7 + 11 + 13 = 41 \)
Number of primes \( = 6 \)
Arithmetic Mean \( = \frac{41}{6} \approx 6.83 \)
Therefore, the mean of the first 6 prime numbers is approximately 6.83.
Quick Reference: Summary of Arithmetic Mean Concepts
Concept | Definition / Formula | Usage |
|---|---|---|
Arithmetic Mean (Ungrouped Data) | \( \bar{x} = \frac{\sum x_i}{n} \) | Average of individual data points |
Arithmetic Mean (With Frequencies) | \( \bar{x} = \frac{\sum f_i x_i}{\sum f_i} \) | Weighted average when data has frequencies |
Class Mark | \( x_i = \frac{\text{Lower limit} + \text{Upper limit}}{2} \) | Midpoint of class intervals for grouped data |
Direct Method | Calculate mean using class marks and frequencies | Used for grouped frequency distributions |
Mean vs Average | Both represent the sum of values divided by count | Interchangeable in most contexts |
Glossary of Key Terms Related to Arithmetic Mean
Term | Explanation |
|---|---|
Arithmetic Mean | The sum of all data values divided by the number of values. |
Central Tendency | A statistical measure that identifies a single value representing the center of a dataset. |
Frequency | The number of times a particular value or class occurs in a dataset. |
Class Interval | A range of values grouped together in frequency distribution. |
Class Mark | The midpoint of a class interval used to represent the entire class. |
Grouped Data | Data organized into classes or intervals with frequencies. |
Ungrouped Data | Raw data presented as individual values without grouping. |
Direct Method | A technique to calculate mean using class marks and frequencies directly. |
Sample | A subset of data taken from a larger population for analysis. |
Average | Another term for arithmetic mean, representing the central value. |
Frequently Asked Questions on Arithmetic Mean
What does arithmetic mean represent in statistics?
It represents the average value of a dataset, calculated by dividing the sum of all observations by the total number of observations.
How is the arithmetic mean calculated when data includes frequencies?
Multiply each observation by its frequency, sum these products, and then divide by the total frequency count.
Can the arithmetic mean be used for grouped data?
Yes, by calculating the class marks for each interval and using the frequencies, the mean can be estimated using the direct method.
Is the arithmetic mean the same as the average?
In most contexts, yes. Both terms refer to the sum of values divided by the number of values.
What is the formula to find the class mark of an interval?
The class mark is the midpoint of the interval, calculated as \( \frac{\text{Lower limit} + \text{Upper limit}}{2} \).