Understanding Linear Equations in Two Variables and Their Graphs
Fundamentals of Linear Equations with Two Variables
Defining Linear Equations in Two Variables
Linear equations are algebraic expressions where the highest exponent of the variables is one. When these equations involve exactly two variables, they are called linear equations in two variables. Such equations typically take the form \( ax + by + c = 0 \), where \( a \), \( b \), and \( c \) are real numbers, and both \( a \) and \( b \) are non-zero to ensure the equation truly depends on two variables.
Another common representation is \( ax + by = 0 \), which also qualifies as a linear equation in two variables under the same conditions for \( a \) and \( b \).
Finding Solutions to Linear Equations in Two Variables
Understanding the Solution Set
The solution to a linear equation in two variables is any ordered pair \( (x, y) \) that satisfies the equation when substituted. Unlike equations with a single variable, these have infinitely many solutions because there are countless pairs that can fulfill the equation.
For instance, the equation \( 4x + y = 8 \) has solutions such as \( (0, 8) \), \( (2, 0) \), and \( (1, 4) \), since substituting these pairs into the equation makes it true.
Solution:
Substitute \( x = 3 \) and \( y = -4 \) into the equation:
\[ 4 \times 3 + (-4) = 12 - 4 = 8 \]
Since the left-hand side equals the right-hand side, \( (3, -4) \) is indeed a solution.
Graphical Representation of Linear Equations in Two Variables
Plotting Solutions on the Coordinate Plane
Each solution \( (x, y) \) of a linear equation corresponds to a point on the Cartesian plane. By plotting multiple such points, we observe that they align to form a straight line. This line visually represents all possible solutions of the equation.
Consider the equation:
\[ 3x + 2y = 12 \]
Some solutions include \( (0, 6) \), \( (4, 0) \), \( (2, 3) \), and \( (6, -3) \). These points can be tabulated as follows:
| \( x \) | \( y \) |
|---|---|
| 0 | 6 |
| 4 | 0 |
| 2 | 3 |
| 6 | -3 |
Plotting these points on the coordinate plane and connecting any two of them will produce a straight line representing the equation.
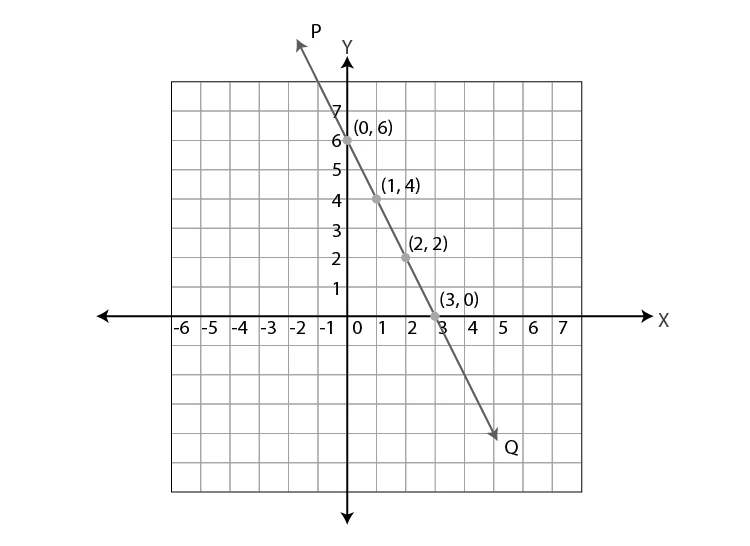
To confirm, take the point \( (5, -1.5) \) on this line and check if it satisfies the equation:
\[ 3 \times 5 + 2 \times (-1.5) = 15 - 3 = 12 \]
Since the equality holds, \( (5, -1.5) \) is a valid solution, confirming that every point on the line corresponds to a solution of the equation.
Key Insights on Graphing Linear Equations
Summary of Graphical Properties
From the graphical perspective, the following points are essential:
- Every point lying on the line represents a solution to the linear equation.
- Conversely, every solution to the equation corresponds to a point on the line.
- This geometric representation justifies the term "linear" since the graph forms a straight line.
Thus, graphing linear equations in two variables provides a visual understanding of their infinite solution set.
Quick Reference: Linear Equations in Two Variables
| Concept | Details |
|---|---|
| General Form | \( ax + by + c = 0 \), with \( a, b \neq 0 \) |
| Number of Solutions | Infinite ordered pairs \( (x, y) \) |
| Graphical Representation | Straight line on Cartesian plane |
| Solution Verification | Substitute \( (x, y) \) into equation to check equality |
| Example Equation | \( 3x + 2y = 12 \) |
Glossary of Important Terms
| Term | Definition |
|---|---|
| Linear Equation | An equation where variables have degree one. |
| Variable | A symbol representing an unknown value. |
| Coefficient | The numerical factor multiplying a variable. |
| Constant | A fixed number without variables. |
| Ordered Pair | A pair \( (x, y) \) representing coordinates on a plane. |
| Solution | A value or set of values satisfying an equation. |
| Coordinate Plane | A two-dimensional plane defined by x- and y-axes. |
| Graph | A visual representation of equations or data points. |
| Intercept | The point where a graph crosses an axis. |
| Degree of Equation | The highest power of the variable(s) in the equation. |
Frequently Asked Questions
What distinguishes a linear equation from a non-linear one?
A linear equation has variables raised only to the first power and graphs as a straight line, whereas non-linear equations involve higher powers or products of variables and produce curves.
How many solutions does a linear equation in two variables have?
It has infinitely many solutions, each represented by a point on the corresponding line in the coordinate plane.
Can any two points be used to graph a linear equation?
Yes, plotting any two solutions and connecting them with a straight line accurately represents the equation's graph.
Why must both coefficients \( a \) and \( b \) be non-zero in \( ax + by + c = 0 \)?
Because if either \( a \) or \( b \) is zero, the equation reduces to a single variable, not representing two variables.
How do you verify if a point is a solution to a linear equation?
Substitute the point's coordinates into the equation; if both sides are equal, the point is a solution.